Fig. 7
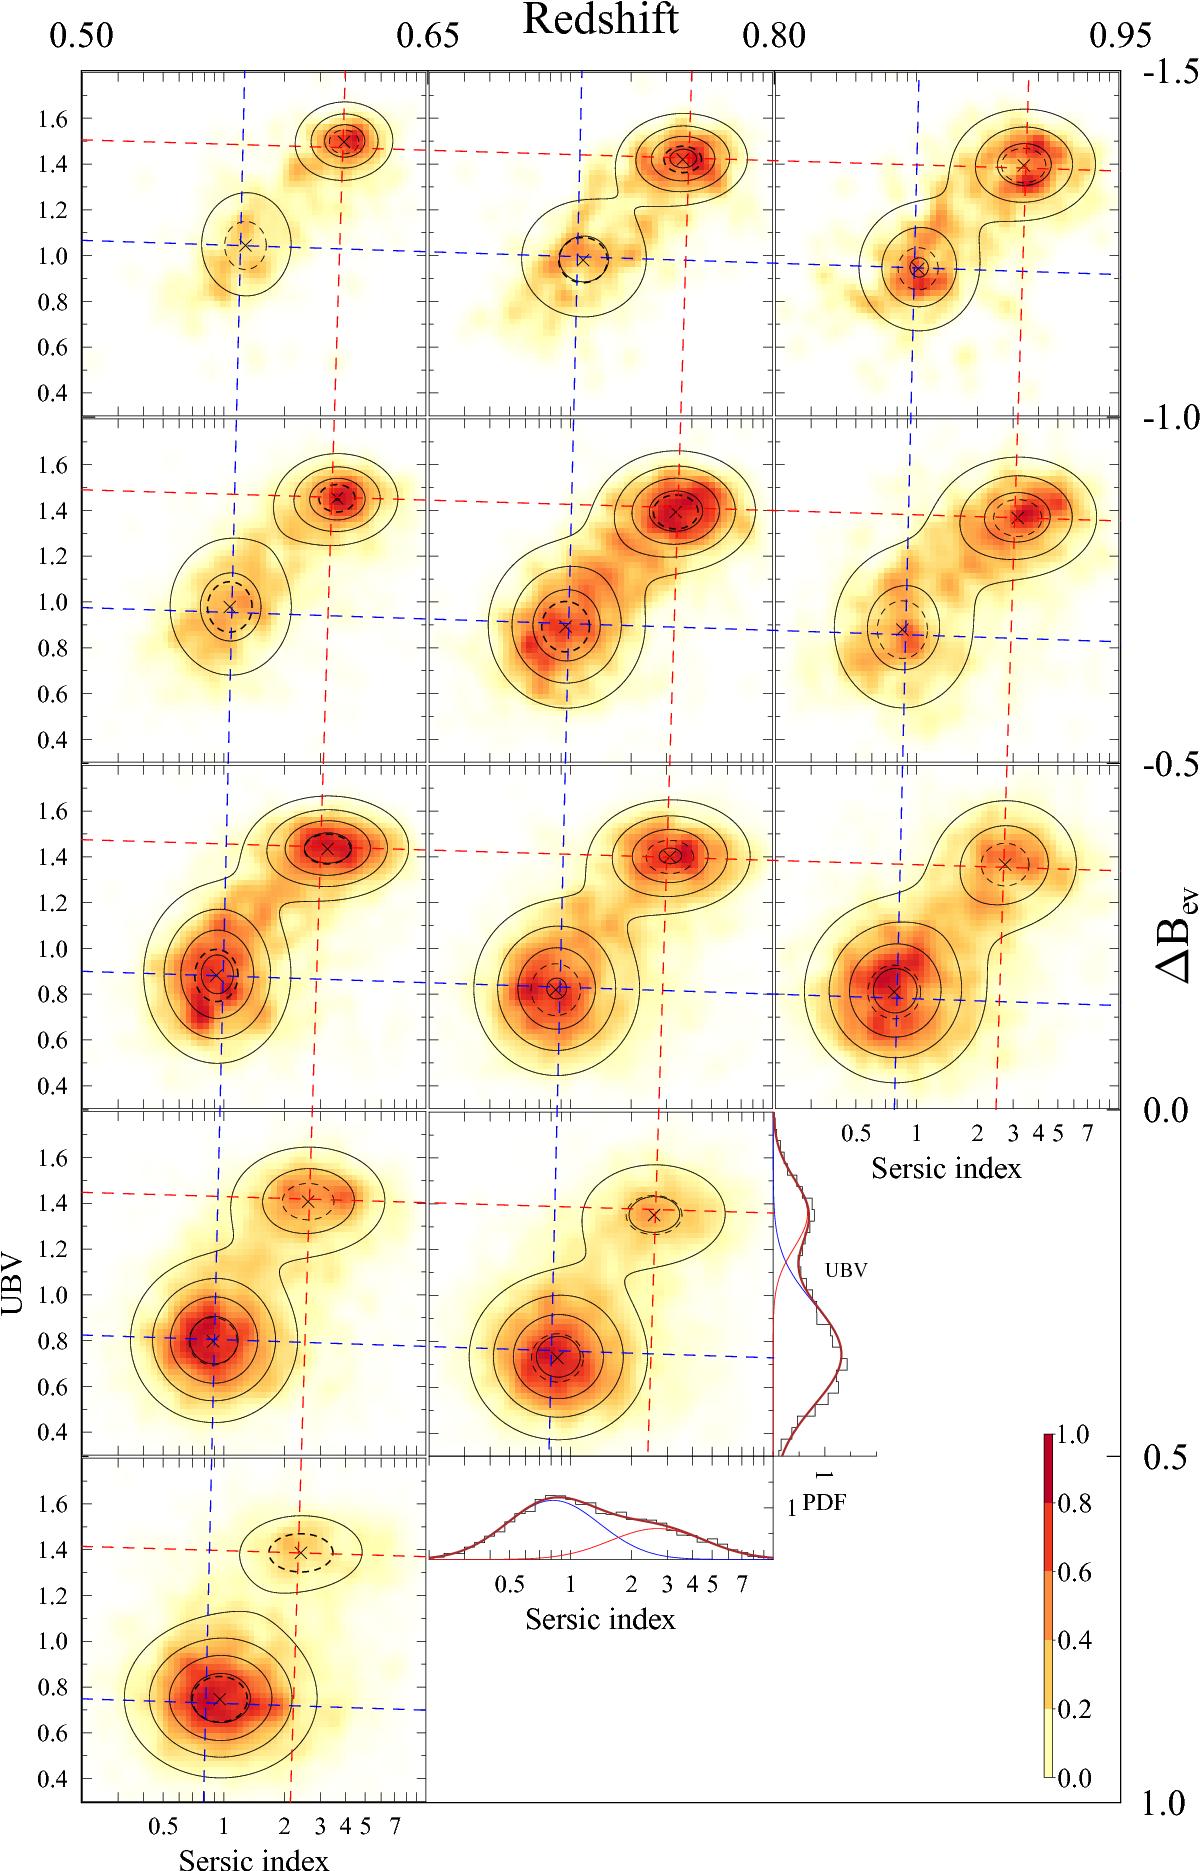
UBV rest-frame colour vs. Sérsic index n distribution. Each panel shows the colour–coded galaxy surface density distribution map of the VIPERS galaxies in each redshift and ΔBev luminosity bin. The colour bar presented in the bottom right corner gives the normalised galaxy surface density. The contour lines show the density values in steps of 0.2 obtained from the two Gaussians bivariate fitting procedure. Blue and red dashed lines show the 2-dimensional model given by Eqs. (11)–(14). Crosses identify the positions of the centre maximal surface density distribution of the given galaxy population. The dashed lines around the peaks show the value of 0.5σ of the Gaussian fit. The histograms present the galaxy distributions projected on the Sérsic index and UBV colour axes, at the bin z = [0.65,0.80] and ΔBev = [0.5,0.0].
Current usage metrics show cumulative count of Article Views (full-text article views including HTML views, PDF and ePub downloads, according to the available data) and Abstracts Views on Vision4Press platform.
Data correspond to usage on the plateform after 2015. The current usage metrics is available 48-96 hours after online publication and is updated daily on week days.
Initial download of the metrics may take a while.