Fig. 5
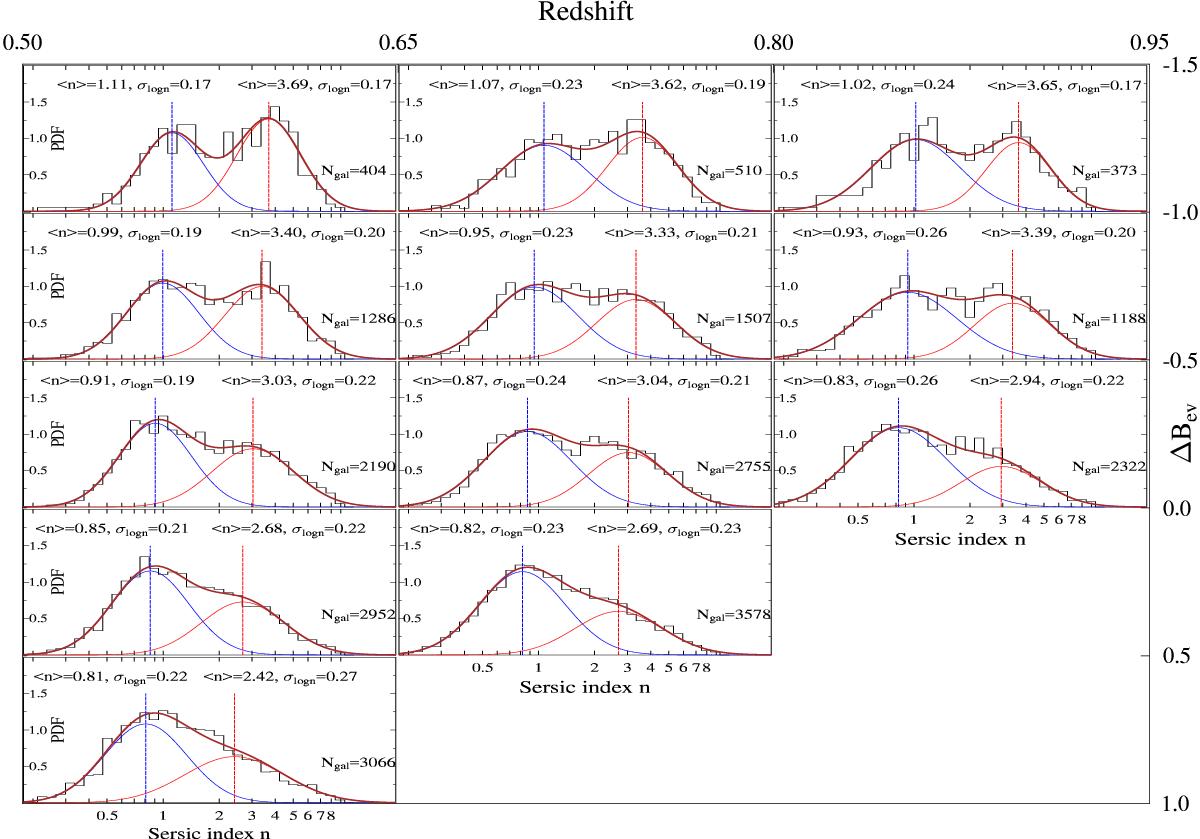
Sérsic index distribution (black histograms) for different redshift (from left to right) and ΔBev luminosity bins (from top to bottom). The blue and red solid lines show the Gaussian fits to the disc-like and spheroid-like populations, respectively. The vertical dashed lines mark the central values of each Gaussian. The sum of the two Gaussian fits is shown as a solid brown line. The central values ⟨ n ⟩ of the Gauss functions, their 1σ widths, and the total number of galaxies in each bin are shown in each panel.
Current usage metrics show cumulative count of Article Views (full-text article views including HTML views, PDF and ePub downloads, according to the available data) and Abstracts Views on Vision4Press platform.
Data correspond to usage on the plateform after 2015. The current usage metrics is available 48-96 hours after online publication and is updated daily on week days.
Initial download of the metrics may take a while.