Fig. 3
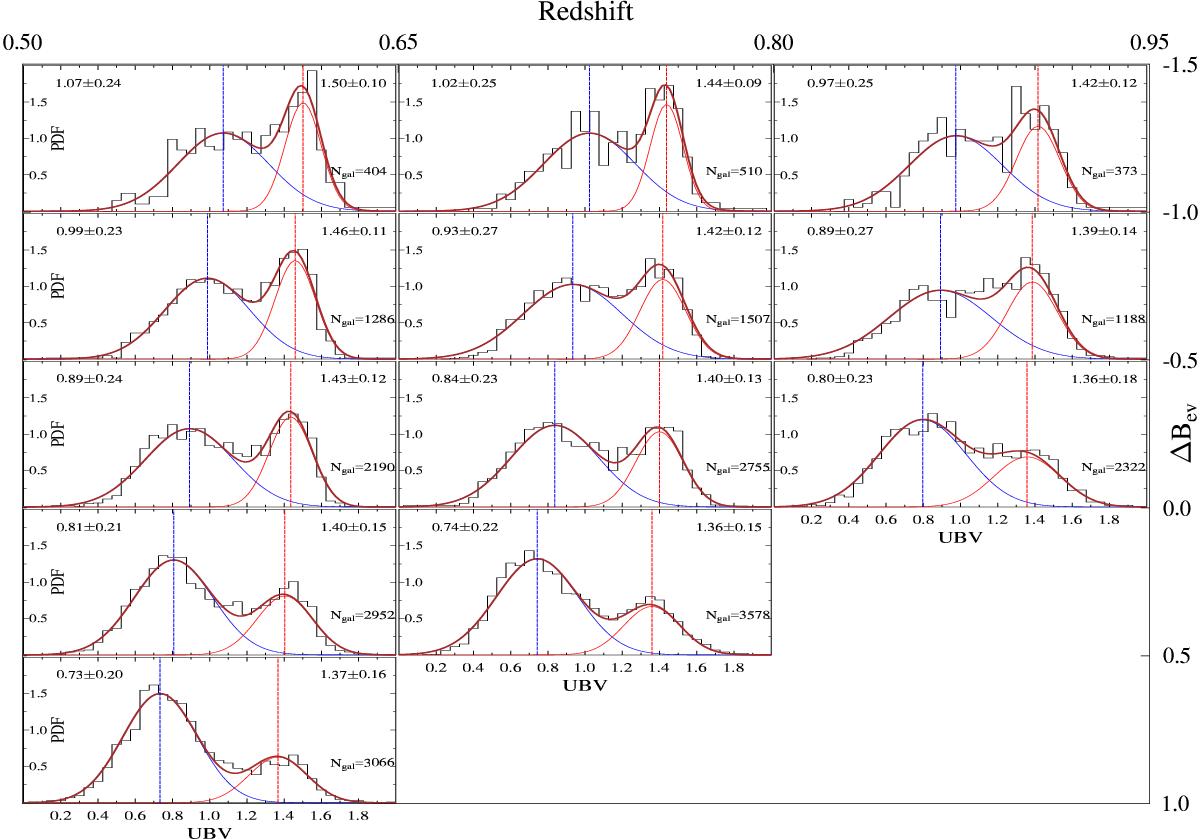
UBV rest-frame colour distributions (black histograms) of VIPERS galaxies in different redshift (increasing from left to right) and luminosity (from top to bottom) bins. The blue and red curves represent the Gaussian components fitting the colour distribution of the two galaxy populations, and the vertical dashed lines mark the maxima of the Gauss functions. The solid brown line shows the sum of the two Gaussians. The central values and 1σ widths of the Gaussians for the blue and red galaxy populations are labeled in each panel, in the top left and right respectively. The number of galaxies considered in each bin is also shown in the bottom right of each panel.
Current usage metrics show cumulative count of Article Views (full-text article views including HTML views, PDF and ePub downloads, according to the available data) and Abstracts Views on Vision4Press platform.
Data correspond to usage on the plateform after 2015. The current usage metrics is available 48-96 hours after online publication and is updated daily on week days.
Initial download of the metrics may take a while.