Fig. 2
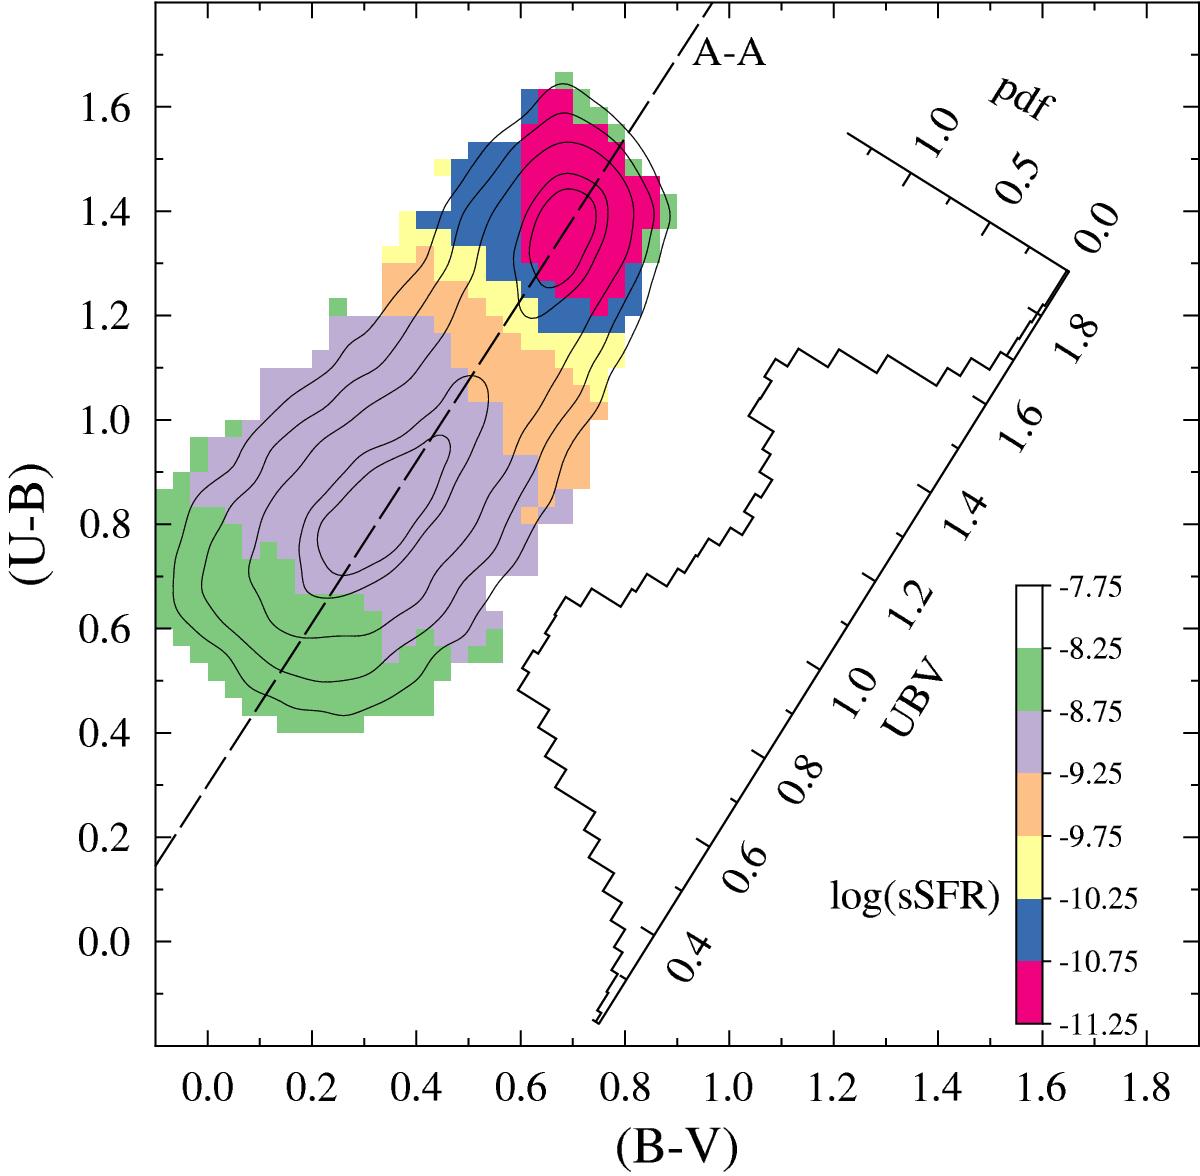
Density of the VIPERS galaxies in the rest-frame (U−B) versus (B−V) colour–colour diagram. The contour lines show the galaxy density distribution in five equally spaced levels from 10% to 99% of the maximum value. The histogram shows the galaxy number density distribution projected along the line A−A connecting the two maxima of this distribution. The colours show the median sSFR 1/yr values of galaxies derived from SED fitting in seven equally spaced logarithmic bins.
Current usage metrics show cumulative count of Article Views (full-text article views including HTML views, PDF and ePub downloads, according to the available data) and Abstracts Views on Vision4Press platform.
Data correspond to usage on the plateform after 2015. The current usage metrics is available 48-96 hours after online publication and is updated daily on week days.
Initial download of the metrics may take a while.