Fig. B.2
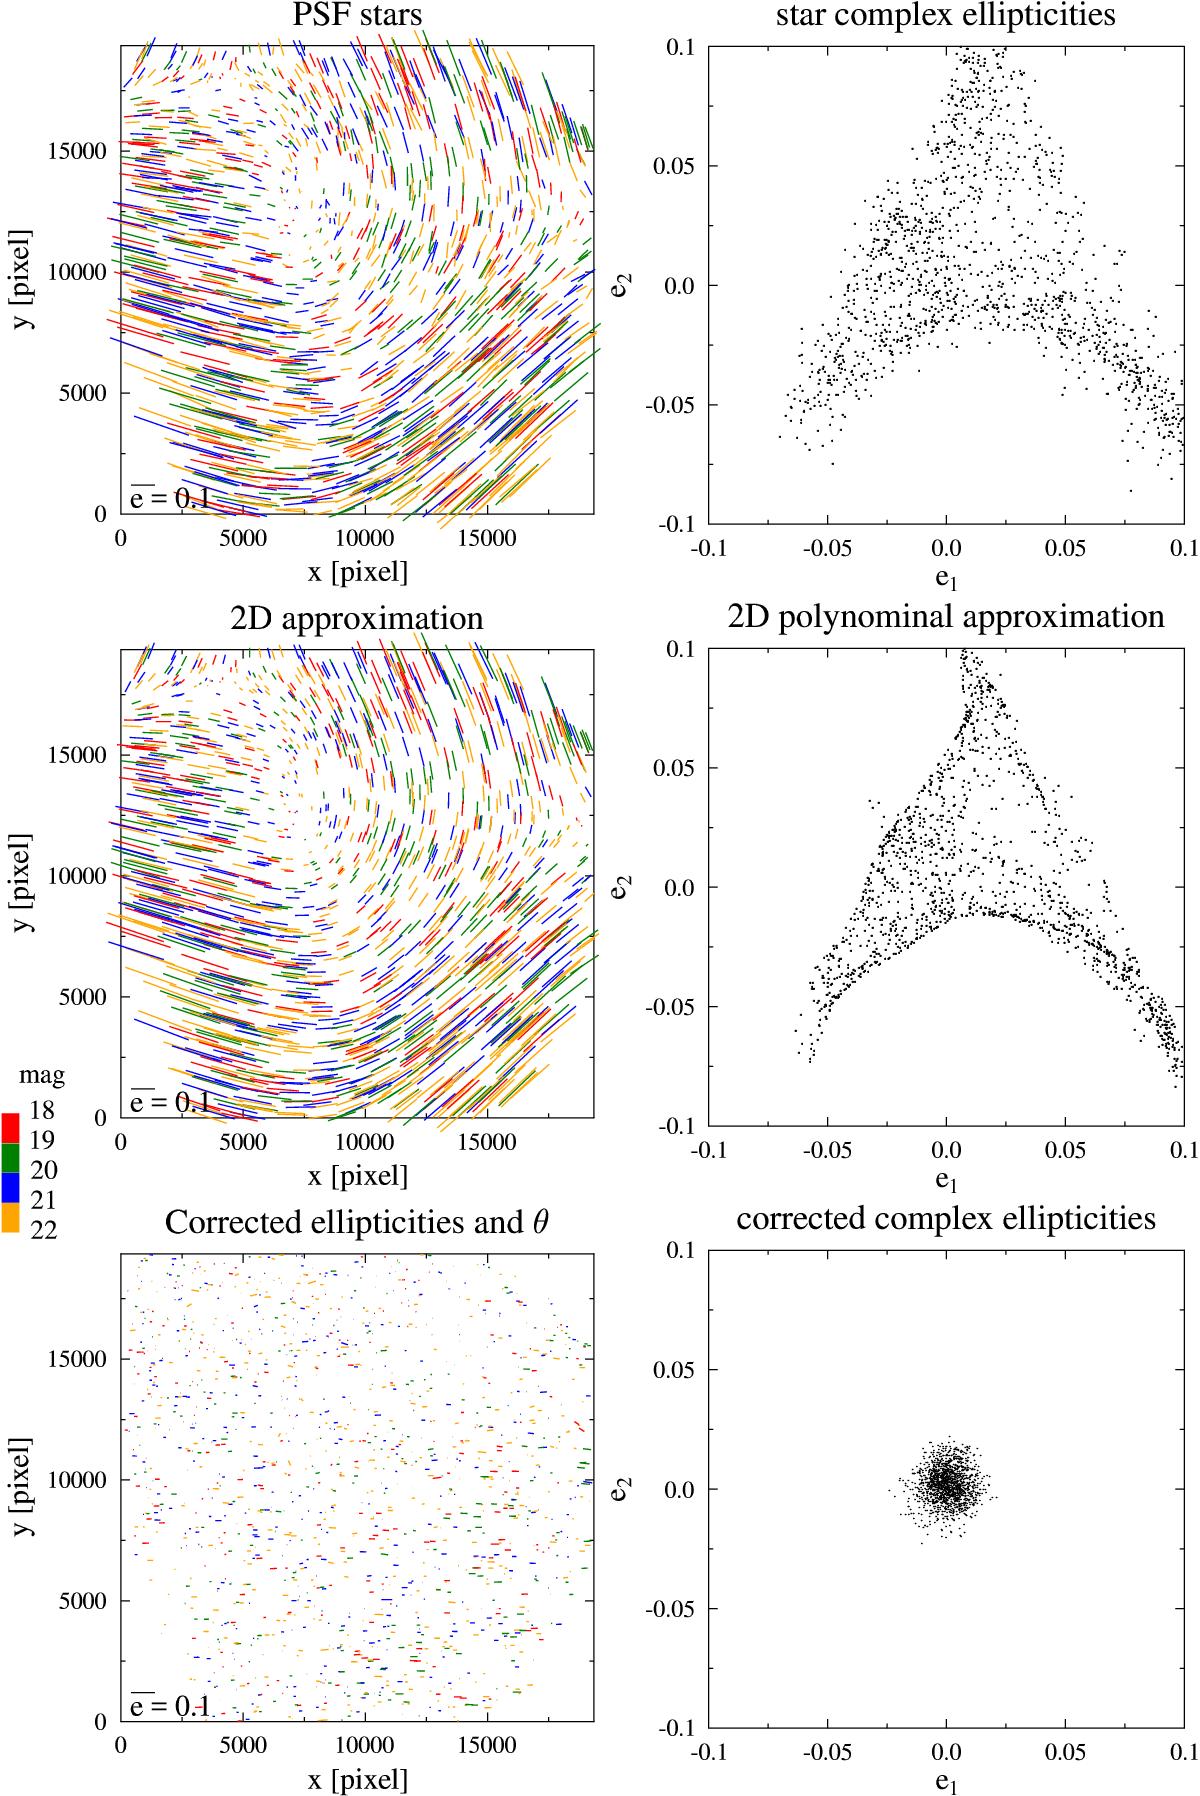
Whisker plot (left column) and the complex ellipticities (right column) obtained from the PSF parameters for the 022539-041200 tile in the i-band. The upper panels show the results obtained from uncorrected star ellipticities, the middle panels – from the 2D polynomial approximation of the Moffat parameters and the bottom panels – the final results after the correction for the anisotropy was applied. The small bar at the left-bottom corner of all left panels shows the ellipticity e = 0.1. Apparent i magnitudes are marked by colours given in the vertical colour bar: values of 18–19 mag by red, values of 19–20 mag by green, values of 20–21 mag by blue, and values of 21–22 mag by orange.
Current usage metrics show cumulative count of Article Views (full-text article views including HTML views, PDF and ePub downloads, according to the available data) and Abstracts Views on Vision4Press platform.
Data correspond to usage on the plateform after 2015. The current usage metrics is available 48-96 hours after online publication and is updated daily on week days.
Initial download of the metrics may take a while.