Free Access
Fig. B.1
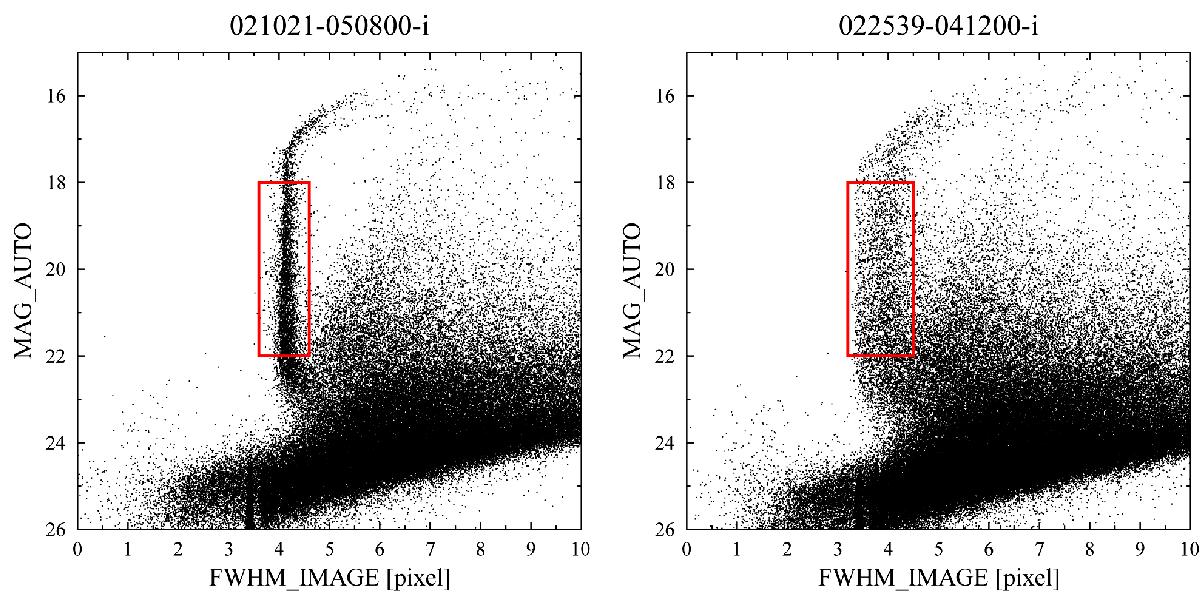
MAG_AUTO versus FWHM_IMAGE plot used to select PSF candidate objects for two CFHTLS tiles with good (left panel) and worse (right panel) image quality. The selected PSF candidate stars are enclosed in the red rectangles.
Current usage metrics show cumulative count of Article Views (full-text article views including HTML views, PDF and ePub downloads, according to the available data) and Abstracts Views on Vision4Press platform.
Data correspond to usage on the plateform after 2015. The current usage metrics is available 48-96 hours after online publication and is updated daily on week days.
Initial download of the metrics may take a while.