Fig. 9
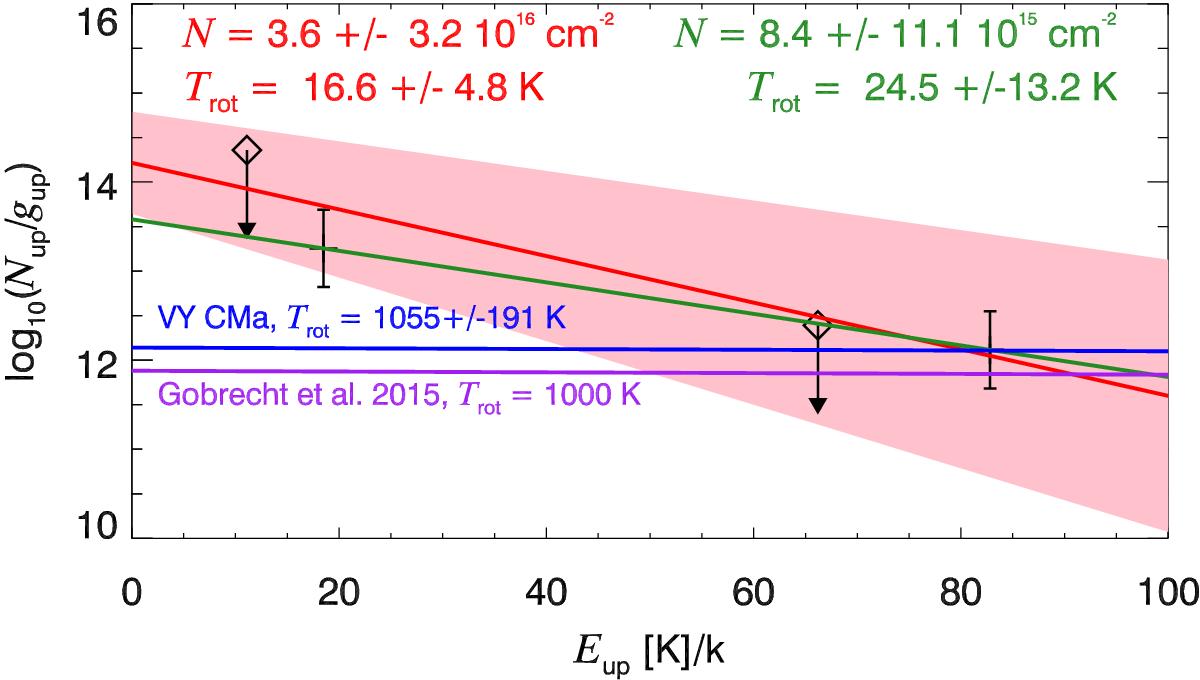
Rotational temperature diagram for IK Tau, assuming an emitting region of 75 mas (20 AU in radius). The red line and red shaded region indicate the fit to the data and 1σ errors on the fit parameters. The green fit is based only on the N = 4−3and9−8 transitions. The purple line represents an abundance of 2.6 × 10⁻⁸ in combination with a likely representative rotational temperature of 1000 K (Gobrecht et al. 2016). The blue line represents the Trot and Ncol values found by Kamiński et al. (2013) for AlO around VY CMa.
Current usage metrics show cumulative count of Article Views (full-text article views including HTML views, PDF and ePub downloads, according to the available data) and Abstracts Views on Vision4Press platform.
Data correspond to usage on the plateform after 2015. The current usage metrics is available 48-96 hours after online publication and is updated daily on week days.
Initial download of the metrics may take a while.