Fig. 7
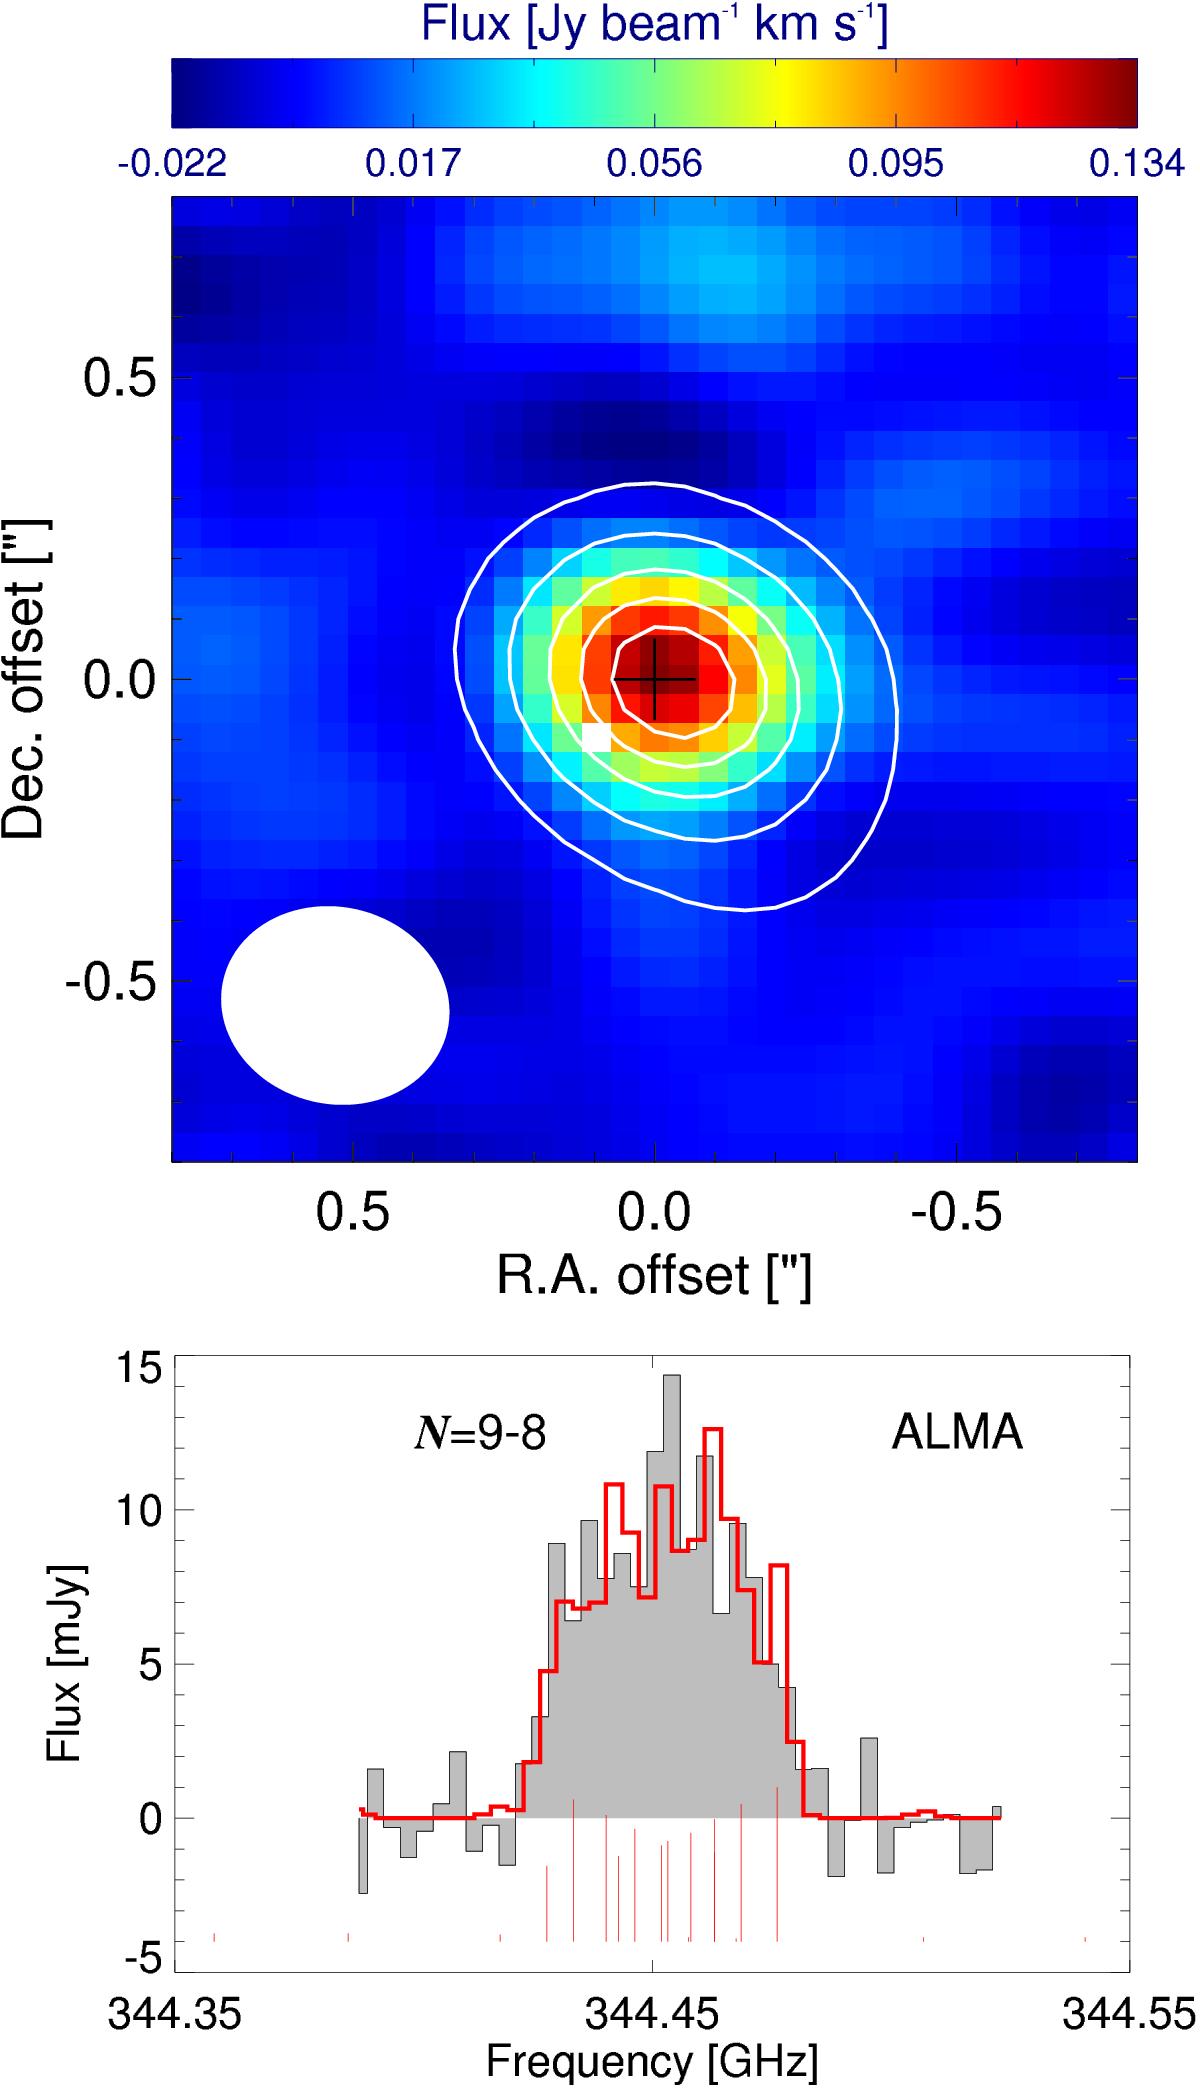
Same as Fig. 6, but for R Aqr. Top panel: colour map of integrated intensity. Contours indicate continuum emission at 3,10,20,30,and40σ. The plus sign designates the position of the star, the filled white ellipse the synthesised beam. Bottom panel: spectrum extracted for the central pixel (black). The vertical red lines indicate the relative strength of the HFS components. The red histogram represents a multi-component synthetic line profile with a FWHM of 5.0 km s-1.
Current usage metrics show cumulative count of Article Views (full-text article views including HTML views, PDF and ePub downloads, according to the available data) and Abstracts Views on Vision4Press platform.
Data correspond to usage on the plateform after 2015. The current usage metrics is available 48-96 hours after online publication and is updated daily on week days.
Initial download of the metrics may take a while.