Fig. 6
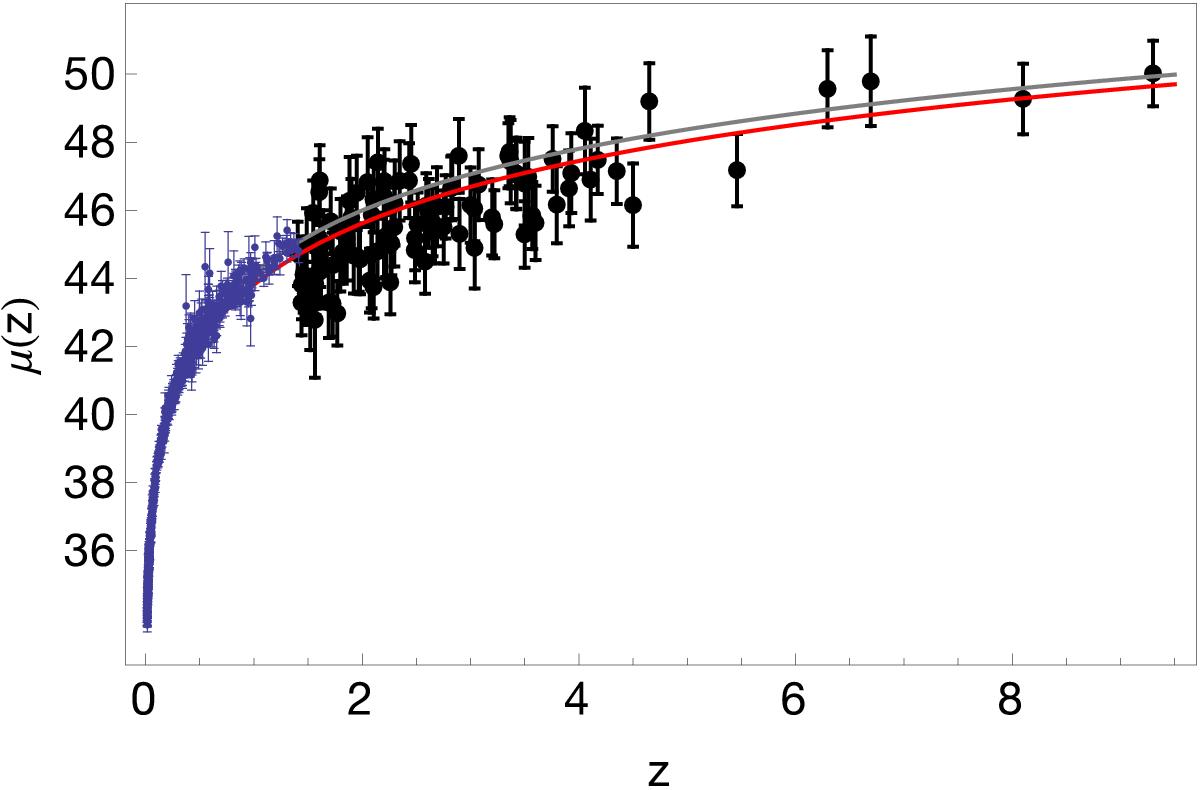
Calibrated GRB Hubble diagram (black filled diamond) up to very high values of redshift, as constructed by applying the local regression technique with the Reichart likelihood: we show overplotted the behavior of the theoretical distance modulus μ(z) = 25 + 5log dL(z) corresponding to the favored fitted CPL model (red line), with w0 = −0.29, w1 = −0.12, h = 0.74, Ωm = 0.24, and the standard ΛCDM model (gray line) with Ωm = 0.33, and h = 0.74. They are defined by Eqs. (12) and (21). The blue filled points at lower redshift are the SNIa data.
Current usage metrics show cumulative count of Article Views (full-text article views including HTML views, PDF and ePub downloads, according to the available data) and Abstracts Views on Vision4Press platform.
Data correspond to usage on the plateform after 2015. The current usage metrics is available 48-96 hours after online publication and is updated daily on week days.
Initial download of the metrics may take a while.