Fig. 2
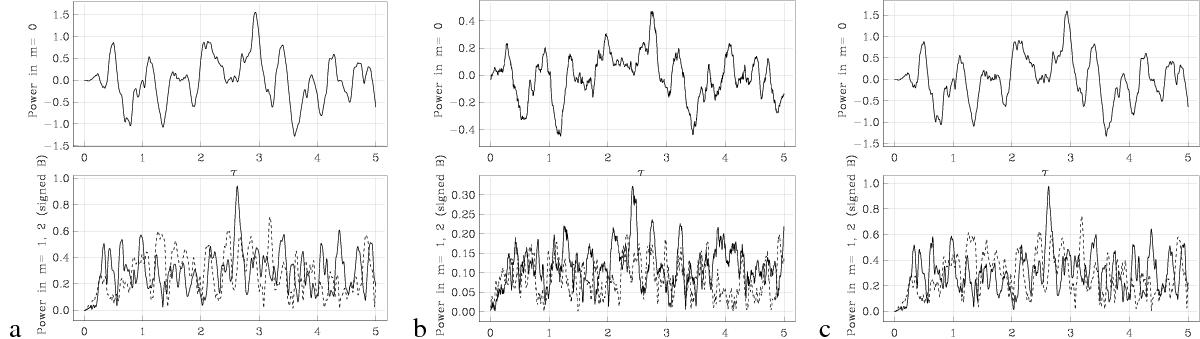
Evolution of Fourier components m = 0,1,2 for: a) the external field of the model of Fig. 1a with ηh = 25; b) the internal field of this model; c) the external field of the model shown in Fig. 1c (ηh = 1). In each case the upper panel shows the power in mode m = 0, and the lower panel that in modes m = 1,2 (solid and broken curves respectively).
Current usage metrics show cumulative count of Article Views (full-text article views including HTML views, PDF and ePub downloads, according to the available data) and Abstracts Views on Vision4Press platform.
Data correspond to usage on the plateform after 2015. The current usage metrics is available 48-96 hours after online publication and is updated daily on week days.
Initial download of the metrics may take a while.