| Issue |
A&A
Volume 598, February 2017
|
|
|---|---|---|
| Article Number | A81 | |
| Number of page(s) | 7 | |
| Section | Stellar structure and evolution | |
| DOI | https://doi.org/10.1051/0004-6361/201628863 | |
| Published online | 03 February 2017 | |
Peculiar objects towards 3FGL J0133.3+5930: an eclipsing Be star and an active galactic nucleus
1 Departamento de Física, Escuela Politécnica Superior de Jaén, Universidad de Jaén, Campus Las Lagunillas s/n, A3, 23071 Jaén, Spain
e-mail: This email address is being protected from spambots. You need JavaScript enabled to view it.
2 Departamento de Ingeniería Mecánica y Minera, Escuela Politécnica Superior de Jaén, Universidad de Jaén, Campus Las Lagunillas s/n, A3, 23071 Jaén, Spain
e-mail: This email address is being protected from spambots. You need JavaScript enabled to view it.
3 Departament de Física Quàntica i Astrofísica, Institut de Ciències del Cosmos, Universitat de Barcelona, IEEC-UB, Martí i Franquès 1, 08028 Barcelona, Spain
e-mail: This email address is being protected from spambots. You need JavaScript enabled to view it.
4 Institut de Ciències del Cosmos (ICCUB), Universitat de Barcelona (IEEC-UB), Martí i Franquès, 1, 08028 Barcelona, Spain
5 ICREA, Pg. Lluís Companys 23, 08010 Barcelona, Spain
Received: 6 May 2016
Accepted: 11 November 2016
Abstract
Aims. We aim to contribute to the identification of unassociated gamma-ray sources in the galactic plane to enlarge the currently known population of gamma-ray binaries and related systems, such as radio-emitting X-ray binaries and microquasars. These objects are currently regarded as excellent test beds for the understanding of high-energy phenomena in stellar systems.
Methods. Potential targets of study are selected based on cross-identification of the third Fermi Large Area Telescope catalogue with historical catalogues of luminous stars that have often been found as optical counterparts in known cases. Follow-up observations and analysis of multi-wavelength archival data are later used to seek further proofs of association beyond the simple positional agreement.
Results. Current results enable us to present here the case of the Fermi source 3FGL J0133.3+5930 where two peculiar objects have been discovered inside its region of uncertainty. One of them is the star TYC 3683-985-1 (LS I +59 79) whose eclipsing binary nature is reported in this work. The other is the X-ray source Swift J0132.9+5932, which we found to be a likely low-power active galactic nucleus at z = 0.1143 ± 0.0002. If this second object is of blazar type, it could easily account for the observed gamma-ray photon flux. However, this is not confirmed at present, thus rendering the star system TYC 3683-985-1 as a still possible alternative counterpart candidate to the Fermi source.
Key words: binaries: eclipsing / stars: individual: TYC 3583-985-1 / gamma rays: general / X-rays: general
© ESO, 2017
1. Introduction
Unassociated gamma-ray sources provide one of the greatest challenges in observational astronomy, when scientists are confronted with the problem of determining which type of celestial object is responsible for the detected high or very high energy photons from an often poorly (~0.°1–0.°5) defined direction. More than 30% of the approximately three thousand sources of GeV photons in the third Fermi Large Area Telescope (LAT) source catalogue (3FGL, Acero et al. 2015) lack an associated counterpart at lower energies. A similar problem exists for high-energy sources in the TeV domain, such as those detected using the current generation of Cherenkov telescopes. About 20% of the TeV sources in the current version of the TeVCat catalogue1 also lack a lower energy counterpart.
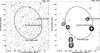 |
Fig. 1 Left: the 95% confidence ellipse of the gamma-ray source 3FGL J0133.3+5930 overplotted against the Second Digitized Sky Survey (red) distributed by the Space Telescope Science Institute. The small black and the tiny red circles indicate the positions of the ROSAT and Swift X-ray sources inside the Fermi LAT ellipse, respectively. TYC 3683-985-1 is the brightest star at the edge of the ROSAT circle. Right: same field as it appears in radio at the 20 cm wavelength according to the NVSS. The contour levels shown correspond to −3, 3, 4, 5, 6, 8, 10, 15, 20, 30, 40, 50, 60, 80, 100, 150, and 200 times the rms noise level of 0.4 mJy beam-1. The lower right circle illustrates the NVSS restoring beam with 45′′ FWHM. |
In the past, some unassociated gamma-ray sources near the galactic equator were shown to belong to the selected class of gamma-ray binaries. These stellar systems are remarkable laboratories for high-energy astrophysics because most of their power is radiated beyond 1 MeV (Dubus 2013; Paredes et al. 2013). Objects such as LS 5039 and LS I +61 303 provide very representative examples of this new type of sources (Paredes et al. 2000; Aharonian et al. 2005; Albert et al. 2006), where the optically visible companion is typically a luminous early-type star.
In this context, the present work builds on our previous efforts to contribute to enlarge the known population of binary systems with a significant gamma-ray component in their spectral energy distribution (SED). The general outline of our approach has been described in Martí et al. (2015), and is based on a joint cross-identification of 3FGL gamma-ray sources against different optical, X-ray and radio catalogues.
Here, we report our study of the unassociated Fermi source 3FGL J0133.3+5930, which we intensively explored in our quest for new gamma-ray binaries. The selection process of this 3FGL target and the follow-up observational analysis of its 95% confidence ellipse is presented. Inside it, two peculiar objects have been found. The first is the Be star TYC 3683-985-1 and the second a Swift X-ray emitter. Their observational properties and possible association with the gamma-ray source are addressed in the following sections.
2. Target selection
Our attention focused on 3FGL J0133.3+5930 as a continuation of our work in Martí et al. (2015), which was aimed at selecting early-type stars that show indications of non-thermal signatures. The main source of optical stellar information came from the catalogues collectively know as Luminous Stars in the Northern Milky Way (LS) that was pioneered by Hardorp et al. (1959). After cross-correlating the 3FGL source list with LS catalogues, the Be star TYC 3683-985-1 was found to be well inside the 95% confidence ellipse of this Fermi LAT gamma-ray source. Also known as LS I +59 79, this optical star is a bright B1/2Vnne object (V = 10.7) according to McCuskey et al. (1974). Remarkably, these authors have flagged this star as a possible variable object more than 40 years ago. Based on the adopted spectral type and the observed magnitudes, we estimate an approximate colour excess E(B−V) ≃ 0.4 mag and a distance of about 2 kpc. In addition, TYC 3683-985-1 appears to be consistent with the X-ray source 1RXS J013326.9+592946 in the ROSAT All-Sky Survey (RASS) faint source catalogue (Voges et al. 2000). All these facts rendered our original suspicion conceivable that TYC 3683-985-1 could be related to the Fermi emission and prompted an intense observational follow-up aimed to seek further evidence.
In the two panels of Fig. 1, we provide a general picture of the Fermi, optical, and ROSAT sources mentioned so far. Other sources detected by the Swift X-ray observatory (Stroh & Falcone 2013) and the NRAO VLA Sky Survey (NVSS, Condon et al. 1998) are also included. We refer again to them in the sections below.
3. Observational follow-up
We started our observational efforts by carrying out optical photometry with two main goals. First, to confirm the possible TYC 3683-985-1 variability suggested by McCuskey et al. (1974), and second, to check whether this variability revealed some type of periodicity that could be related to the orbital cycle of a binary star. The 3FGL J0133.3+5930 variability index amounts to 42.6 in the latest Fermi catalogue, implying that γ-ray variability was not confidently detected during the first four years of the mission. In parallel, we also inspected the different archives of radio, X-ray, and gamma-ray observatories to better assess the possible low-energy counterpart of 3FGL J0133.3+5930 from a multi-wavelength point of view.
3.1. Optical photometry
A campaign of 45 nights of CCD photometric observations was conducted starting on 18 September 2015 and ending on 2 March 2016 using the 41 cm University of Jaén Telescope (UJT), equipped with a set of UBVRcIc Johnson-Cousins filters. Despite being located inside an urban area, this equipment enables differential photometry measurements with typical 0.01–0.02 mag accuracy for objects as bright as TYC 3683-985-1. We refer to Martí et al. (2016) for a more detailed description of the UJT instrumental setup and observation procedure. The absolute magnitudes of comparison stars in the field were derived by performing absolute photometry based on Landolt (1992) standards on selected clear nights.
During the first months, the UJT observations were performed on a daily basis and variability with a ~0.1 mag amplitude in all filters was discovered with an apparent period of about 32 d. After January 2016, we searched for short-term variability by monitoring TYC 3683-985-1 over intervals of several hours per night. To our surprise, clear brightness changes were also detected at the ~0.1 mag level on timescales of hours. The acquisition of further hours of photometry on nearly consecutive nights enabled us to perform a more accurate period search. The resulting periodogram using the phase dispersion minimization (PDM) method by Stellingwerf (1978) is presented in Fig. 2. This PDM plot clearly shows a deep minimum at 0.9701 ± 0.0003 d and higher harmonics. At this point, the situation became clearer as we realized that the 32 d photometric modulation initially obtained from the 2015 data alone was, in fact, the beating period between the PDM minimum associated period and the Earth rotation. Although not shown in Fig. 2, this beating period is also recovered by the PDM technique. The folded light curves were very reminiscent of an eclipsing binary system, where the true orbital period is twice the PDM result. Modelling of the light curves to be discussed later strongly supports this interpretation. Therefore, the TYC 3683-985-1 orbital period is established to be 1.9402 ± 0.0006 d. This value is also confirmed when other periodogram methods are used, such as the CLEAN and the Lomb-Scargle algorithms (Roberts et al. 1987; Scargle 1982). Phase zero is set at HJD 2 457 378.306, which corresponds to the time of the first deepest minimum observed. The whole UJT photometric data set is presented in Fig. 3 plotted as a function of orbital phase.
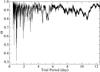 |
Fig. 2 PDM periodogram of the V-band observations of TYC 3683-985-1 where the statistic Θ displays a very deep minimum for a trial period of 0.97 d, which we interpret as half the true orbital period of the system. |
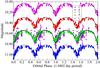 |
Fig. 3 UBVRcIc light curves of TYC 3683-985-1 as observed with the UJT and folded using the orbital period value of 1.9402 d reported in this work. The continuous lines correspond to the synthetic light curves generated using the PHOEBE software packages with the physical parameters listed in Table 1. HJD 2 457 378.306 has been adopted as phase origin. All points are plotted twice for easier display. |
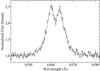 |
Fig. 4 Optical spectrum of TYC 3683-985-1 in the Hα region as observed with the NOT telescope and the FIES instrument. |
3.2. Optical spectroscopy
TYC 3683-985-1 was observed with the Nordic Optical Telescope (NOT) on 3 February 2016. The FIES cross-dispersed high-resolution echelle spectrograph was used. The acquired frames were reduced and calibrated using the standard procedures embedded in the FIEStool pipeline for automated data reduction. Because of unfortunate bad weather conditions, only the red part of the spectrum remained barely acceptable for science purposes. In Fig. 4 we display the Hα emission line of TYC 3683-985-1, where a clear double-peak profile is evident. By deblending the emission with two Voigt profile components2, we estimate a peak-to-peak separation of ΔV ≃ 200 km s-1 and a total equivalent width EW ≃ −16 Å.
Another NOT spectrum was obtained on 22 September 2016 under better observing conditions with similar Hα parameters. In addition, we were able to detect the He I lines at 4026, 4143 and 4387 Å. The full-width at half-maximum (FWHM) of these absorption features is correlated with the projected rotational velocity according to Steele et al. (1999). Using their expressions, we derive vsini = 290 ± 20 km s-1.
3.3. Re-analysis of TYC 3683-985-1 in archival X-ray data
The software packages HEAsoft/FTOOLS and Xselect were used here for X-ray data reduction. We downloaded the original RASS event file corresponding to the 1RXS J013326.9+592946 detection in the 0.1–2.4 keV energy range. Re-analysis of these data resulted in a very marginal detection, suggesting that this X-ray source could be spurious. Based on the star colour excess, the equivalent hydrogen column density is estimated to be NH ≃ 2.3 × 1021 cm-2 using standard relationships (Bohlin et al. 1978). Assuming a typical photon index Γ = 2, the source count rate of about 0.038 counts s-1 would translate into an X-ray luminosity of approximately 9 × 1032 erg s-1 in the ROSAT energy band. From Table 2 of Berghoefer et al. (1996), we estimate the typical ROSAT luminosity of isolated Be stars as close to 1030.6 ± 0.9 erg s-1. Therefore, the 1RXS J013326.9+592946 luminosity appears to be well above the high-end range of individual emission-line B stars.
At present, only the Swift X-ray observatory has covered the TYC 3683-985-1 field of view on different observing epochs, from 19 February to 3 April 2015, with a total on-source time of about 5 ks. We also retrieved and re-analysed the corresponding Swift event files in the 0.2–10 keV energy range, and were unable to recover the RASS source. The count rate was lower than 0.003 count s-1 at the 3σ level. The luminosity upper limit derived from Swift data would imply a ROSAT luminosity not above 8 × 1031 erg s-1. Therefore, the ROSAT X-ray source initially associated with TYC 3683-985-1 is either spurious or variable by at least one order of magnitude. In the second case, it would have been non-active during all the 2015 X-ray observing dates.
3.4. Another X-ray source present in Swift data
In parallel, the Swift telescope data clearly revealed a different X-ray source at the J2000.0 position RA 01h32m55 2 and Dec + 59°32′14.′′7 with a 90% confidence error circle of 15 arcsec. Hereafter, we refer to it as Swift J0132.9+5932 and this is one of the plotted objects in the panels of Fig. 1. Its count rate amounts to 0.020 ± 0.003 count s-1 corrected for point-spread-function (PSF) effects, thus providing a 7.7σ detection. Its presence inside the Fermi ellipse has been pointed out by Stroh & Falcone (2013). The measured position is 4.75 arcmin away from TYC 3683-985-1 where no X-rays were detected.
A simple power-law fit to the Swift J0132.9+5932 spectrum provides a photon index Γ = 2.5 ± 0.5, together with an equivalent hydrogen column density of NH = (6.7 ± 2.2) × 1021 cm-2. This value translates into a visual extinction of AV = 3.6 ± 1.2 mag, which is equivalent to a colour excess of E(B−V) = 1.2 ± 0.4 mag. Inspection of the Swift J0132.9+5932 daily count rates indicates that this X-ray source is variable up to a factor of ~5 on a timescale τ ~ 10 d. A plot of the observed light curve with PSF and vignetting corrections is presented in Fig. 5.
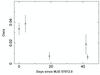 |
Fig. 5 Light curve of the X-ray source Swift J0132.9+5932 inside the 3FGL J0133.3+5930 ellipse showing a clearly variable behaviour on timescales of weeks in the 0.2–10 keV energy range. |
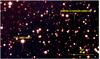 |
Fig. 6 Combined view of the TYC 3683-985-1 field as observed with the UJT in the VRcIc bands (blue, green and red filters, respectively). The total integration time is about 1 h in each photometric band. The locations of TYC 3683-985-1 and the faint 2MASS object consistent with the Swift J0132.9+5932 X-ray source are marked by yellow lines. The horizontal bar sets the angular scale. North is up and east is left. |
To search for the optical counterpart of Swift J0132.9+5932, we combined a large number of the CCD BVRcIc frames acquired for the TYC 3683-985-1 photometry, and performed astrometry on the stacked image shown in Fig. 6. A faint counterpart is apparently consistent with the Swift X-ray source within a few arc-seconds. Using the UJT, we could only detect it with the reddest filters (B> 19.5, V> 18.2, Rc = 17.0 ± 0.1, and Ic = 16.1 ± 0.1). This detection is independently confirmed when inspecting the images from the Two Micron All Sky Survey (2MASS) and its associated catalogue (Cutri et al. 2012). Here, the UJT counterpart is consistent with 2MASS 01325529+5932158. This infrared source also becomes brighter with increasing wavelength (J = 15.425 ± 0.082, H = 14.703 ± 0.096, and Ks = 14.002 ± 0.079). In the NED Extragalactic Database3 this object is catalogued as a galaxy based on its apparent extension. It is also relevant to note here that both the Swift and 2MASS objects are in good position agreement with the radio source NVSS J013255+593217 (see Fig. 1), which was also marginally detected during the Westerbork Northern Sky Survey (WENSS, Rengelink et al. 1997).
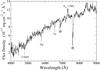 |
Fig. 7 Optical spectrum of 2MASS 01325529+5932158 obtained with the NOT telescope and its ALFOS instrument on 21 September 2016. The most prominent absorption and emission features are identified. All of them are consistent with the redshift value stated in the text. |
To confirm the extragalactic nature of 2MASS 01325529+5932158, we requested additional service time with the NOT telescope and its ALFOSC instrument. The resulting spectrum of 2MASS 01325529+5932158 is displayed in Fig. 7. Different absorption and emission features were detected and all of them are consistent with a cosmological redshift of z = 0.1143 ± 0.0002. This would place the source at a luminosity distance of about 535 Mpc assuming a Hubble constant H0 = 70 km s-1 Mpc-1 in a flat Universe with ΩΛ = 0.28.
3.5. Re-analysis of Fermi archival data
With the idea of searching for the 1.94 d period of TYC 3683-985-1 in Fermi-LAT data, we selected PASS 8 source class events with energies from 100 MeV to 500 GeV within a region of interest (ROI) of 10° side length centred on the 3FGL J0133.3+5930 catalogue position. The LAT dataset spans from 2008-08-04 15:43:36 (UTC) to 2016-01-14 01:41:33 (UTC). The analysis was performed with the Fermi ScienceTools software package v10r0p5. We used only events tagged as “good” and excluded any event with zenith angle above 90° to prevent Earth’s limb contamination, as recommended by the LAT team. The reality of 3FGL J0133.3+5930 is confirmed with a test statistic value of TS = 27. Its gamma-ray spectrum has been obtained by means of a binned maximum likelihood analysis, yielding compatible results with those reported in the 3FGL catalogue (Acero et al. 2015). Its power-law spectral index is Γ = 2.6 ± 0.3, with a photon flux of (8 ± 3) × 10-9 ph cm-2 s-1 in the 0.1–500 GeV range.
The fit results obtained for sources inside the ROI in the full dataset have then been used to perform an unbinned analysis in time bins shorter than the orbital period. A binning interval of 0.9 d, about half the expected orbital period, was selected as a compromise between securing the largest photon counting and the Nyquist sampling rate. As a result, the TYC 3683-985-1 photometric period was not recovered from Fermi data in periodograms computed using both the PDM and CLEAN methods. The most significant periodicities were consistently found at 1.81, 12.25 and 53.10 d. Their possible interpretation is at present beyond the scope of this paper, and only a timescale order of magnitude is considered for discussion purposes.
Values of the main PHOEBE parameters for TYC 3683-985-1.
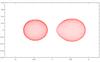 |
Fig. 8 Shape of the TYC 3683-985-1 stellar components resulting from the PHOEBE parameters in Table 1. The primary and secondary stars are located at the left and right side of the plot, respectively. The secondary star is practically filling its Roche lobe. Axes labels are given in units of the semimajor axis. |
4. Discussion
The observational data presented in previous sections have revealed two peculiar objects towards the unassociated gamma-ray source 3FGL J0133.3+5930. Here, we discuss each of them in detail to establish their chances of association with the high-energy emission.
4.1. Nature of TYC 3683-985-1
Suggestive evidence about the binary nature of the star TYC 3683-985-1 has been obtained from UJT observations given the existence of a well-determined photometric period, which we associate with half the orbital cycle. To reinforce this interpretation, we carried out an attempt to model the UBVRcIc light curves using the PHOEBE software package (Prša & Zwitter 2005) based on the Wilson-Deviney code (Wilson & Devinney 1971). At this point, we noted that the plots of observed colours U−B, B−V, V−Rc, and Rc−Ic (not shown here) remained nearly constant throughout all orbital phases. This immediately suggested that the eclipsed photospheres had to be of very similar type. Therefore, the PHOEBE stellar parameters initially adopted were those of a twin pair of B-type main-sequence stars in agreement with the McCuskey et al. (1974) spectral classification. To keep the model as simple as possible, a circular orbit, no spots and the PHOEBE default values were adopted except where stated otherwise. After some iteration, it was soon possible to converge on a set of stellar parameters that reasonably reproduce the overall appearance of the phased light curves in Fig. 3. The main parameter values are given in Table 1.
The PHOEBE fit overplotted in Fig. 3 provides support to the interpretation of TYC 3683-985-1 as an eclipsing binary consisting of a pair of similar, early-type, B-stars. However, it must be regarded as very preliminary since radial velocities from optical spectroscopy are not yet available, and this is a key information to better constrain the mass ratio parameter. Nevertheless, the fit is highly indicative that the secondary star is almost filling its Roche lobe, as illustrated by the plot of stellar shapes in Fig. 8. We therefore interpret a semi-detached binary system. Matter flowing across the inner Lagrangian point (L1) will form a circumstellar or circumbinary disc. Our two spectroscopic observations of TYC 3683-985-1 using the NOT telescope, showing both double-peaked Hα emission (see Fig. 4), agree well with this interpretation and confirm the Be nature of the system. In this case, free-free emission from the Be disc, mostly in ionised form, is expected to be responsible for an emission excess at long infrared wavelengths. This is well visible in the SED of TYC 3683-985-1 plotted in Fig. 9 as compared with the expected photospheric continuum from an early B-type main-sequence Kurucz model4.
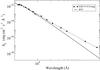 |
Fig. 9 Dereddened SED of TYC 3683-985-1 from optical to infrared wavelengths (dashed line) built from the UJT magnitudes in the maximum and far-infrared data from the WISE bands (Wright et al. 2010). The thick line has been plotted for comparison purposes. It corresponds to a Kurucz model for an isolated B3V star normalised to the B-band emission level where the free-free excess from the circumstellar disc is almost negligible. |
Assuming a Keplerian rotationally dominated profile, the Hα double-peak separation ΔV can provide a measure of the Be disc outer radius given by Huang (1972): ![Mathematical equation: \begin{equation} R_{\rm disc} = R_1 \left[ \frac{2 v\sin{i}}{\Delta V} \right]^2, \end{equation}](/articles/aa/full_html/2017/02/aa28863-16/aa28863-16-eq74.png) (1)where R1 is the radius of the primary star and vsini and ΔV parameters have been estimated from optical spectroscopy. Adopting R1 = 4.2R⊙ from our PHOEBE fit, the expected circumstellar disc radius is Rdisc ≃ 35R⊙. This value exceeds the semi-major axis given in Table 1, thus suggesting that this may be a circumbinary disc in TYC 3683-985-1.
(1)where R1 is the radius of the primary star and vsini and ΔV parameters have been estimated from optical spectroscopy. Adopting R1 = 4.2R⊙ from our PHOEBE fit, the expected circumstellar disc radius is Rdisc ≃ 35R⊙. This value exceeds the semi-major axis given in Table 1, thus suggesting that this may be a circumbinary disc in TYC 3683-985-1.
Finally, the brightness level in the light curves in Fig. 3 does not have a strict repeatability from orbit to orbit, with 0.01–0.05 mag minor differences. We tentatively attribute this to physical effects not taken into account in the binary model, such as Be disc variability, a time-variable hot spot, or intrinsic variability of one of the stellar components.
4.2. Nature of Swift J0132.9+5932/ 2MASS 01325529+5932158
The other peculiar object inside the Fermi confidence ellipse is the infrared source 2MASS 01325529+5932158, found to be coincident with the variable X-ray source Swift J0132.9+5932 and also with NVSS J013255+593217 as a likely radio counterpart. The 2–10 keV luminosity of the X-ray source is 1.7 × 1043 erg s-1. Combining the X-ray properties, the optical spectrum and the multi-wavelength SED (see Fig. 10), an active galactic nucleus (AGN) of BL Lac type can offer a natural explanation for both X-ray and gamma-ray emission detected by Swift and Fermi, respectively. The SED would be a sum of blazar emission and stellar light of the host galaxy dominating in the near-infrared to optical band. The X-ray emission can be understood as the high-frequency side of a synchrotron hump and its steep slope (Γ ≃ 2.5) matches it well while the gamma-ray emission would be the inverse-Compton component with a comparable luminosity. This and the lack of broad-line region (BLR) in Fig. 7 optical spectrum agree with expectations from a BL Lac with a radiatively inefficient disc (see Ghisellini 2016). The host galaxy has a luminosity a few times of ~1044 erg s-1, suggesting ~109M⊙ for the black hole mass of the blazar, which is consistent with the low radiative efficiency mentioned above. It probably has moderate star formation with a star formation rate ~1 M⊙ yr-1 estimated from the Hα luminosity (Kennicutt et al. 1994).
On the other hand, if the Swift source is associated with a normal AGN, that is one of Seyfert type, which would not produce detectable gamma-ray emission, then some problems may arise. The lack of strong absorption, except for the moderate Galactic absorption, in the Swift XRT spectrum indicates little obscuration in the line of sight towards the nucleus. It contradicts the absence of BLR and strong nuclear emission in the optical spectrum. The steep X-ray slope is also uncommon for a normal Seyfert galaxy, although the error on the slope is large.
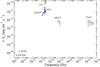 |
Fig. 10 Dereddened SED of the X-ray source Swift J0132.9+5932 also consistent with 2MASS 01325529+5932158 and NVSS J013255+593217, which has been proposed as a possible counterpart of 3FGL J0133.3+5930. Data shown include measurements at radio (WENSS and NVSS), near-infrared (2MASS), optical (UJT and NOT), X-ray (Swift) and gamma-ray (Fermi) frequencies. Triangle symbols represent 3σ upper limits for the B- and V-band non-detections with UJT. |
4.3. Quest for a gamma-ray candidate: binary or AGN?
Two possible objects have emerged as low-energy counterpart candidates to the unassociated source 3FGL J0133.3+5930. Swift J0132.9+5932 could provide a classical blazar-like scenario, but with the available data we cannot rule out a normal AGN, which would be unable to account for the Fermi photon flux at the measured redshift. This leaves the possibility that this might be a stellar source of gamma rays, given the co-location of 3FGL J0133.3+5930 with the Be binary TYC 3683-985-1. However, this system appears to consist of two non-degenerated stars revolving in an eclipsing orbit, which at first glance makes it challenging to attribute it to the origin of high-energy emission. It would not correspond to the normal scenario of a gamma-ray binary (compact companion + non-degenerate star).
Caution is nevertheless advisable here since TYC 3683- 985-1 could turn out to be unusual in some aspect, such as having a highly magnetised early-type component where acceleration of particles could occur in shocks created by strong magnetic activity and powerful magnetic reconnection events. A similar mechanism has been proposed to account for collective gamma-ray emission in stellar magnetospheres of T Tauri stars (del Valle et al. 2011). We point out here that magnetic fields higher than those of T Tauri stars (up to ~10 kG) have been reported for some OB stars, and they are sometimes even highly variable on hourly timescales (Hubrig et al. 2015).
Alternatively, the eclipsing binary nature of TYC 3683- 985-1 may not have been correctly interpreted, and it might be a compact companion orbiting a single Be star. Gamma-ray emission would then be naturally expected. This was initially considered because the observed light curves bear some resemblance to ellipsoidal modulation that would result from a nearly Roche-lobe filling star. However, an ellipsoidal modulation tends to have a more sinusoidal aspect and smaller amplitude (few 0.01 mag), and this is not the case of the light curves in our Fig. 3.
Other radio sources inside the 3FGL J0133.3+5930 ellipse were also considered at some point, but none of them displays X-ray emission, and no evidence of an optically variable counterpart is available.
5. Conclusions
A multi-wavelength analysis of peculiar objects inside the confidence ellipse of the unassociated gamma-ray source 3FGL J0133.3+5930 has been carried out. As a result, only one pair of objects have attracted our attention as possible low-energy counterparts to the Fermi emission.
One of them is the infrared source 2MASS 01325529+ 5932158 that is also detected in X-rays as Swift J0132.9+ 5932. We found this object to be an AGN at z = 0.1143 ± 0.0002. The observed SED agrees with expectations from a blazar and this could provide an easy interpretation of the high-energy emission. However, other less collimated AGN interpretations unable to account for the gamma-ray luminosity (e.g. a Seyfert) can also hold.
The alternative counterpart candidate is the Be star TYC 3683-985-1. After an extensive campaign of photometric observations, we have discovered apparent eclipses with a clear period of 1.9402 ± 0.0006 d that we interpret as the orbital cycle. This period has not been detected yet in the Fermi emission. However, the gamma-ray periodicity analysis was not conclusive enough because, with the current data, the time binning had to be extremely close to the Nyquist sampling limit. Modelling of the TYC 3683-985-1 optical light curves is consistent with a semi-deteached Be binary system whose two components are early-type B stars, one of them filling its Roche lobe. In addition, the observed double-peaked Hα profile suggests that the Be disc is circumbinary. Different physical mechanisms for high-energy photon production in a Be stellar environment have been tentatively proposed. In any case, the non-degenerate nature of
the two components remains to be confirmed since the possibility of one of them being a compact object cannot be strictly ruled out from photometric data only.
Solving the final nature of 3FGL J0133.3+5930 will require additional follow-up observations. VLBI imaging of Swift J0132.9+5932 is likely to settle the question whether it is a highly beamed source. Similarly, radial velocity observations of TYC 3683-985-1 will enable a revision of the component masses, which is necessary to finally assess whether the system is capable of gamma-ray production.
The Voigt profile results from the convolution of Lorentz and Gaussian profiles.
Acknowledgments
This work was supported by grants AYA2013-47447-C3-1-P, AYA2013-47447-C3-2-P, AYA2013-47447-C3-3-P, and FPA2015-69210-C6-2-R from the Spanish Ministerio de Economía y Competitividad (MINECO), and by the Consejería de Economía, Innovación, Ciencia y Empleo of Junta de Andalucía under excellence grant FQM-1343 and research group FQM-322, as well as FEDER funds. J.M.P., K.I., and M.R. acknowledge support from MINECO under grant MDM-2014-0369 of ICCUB (Unidad de Excelencia “María de Maeztu”), and the Catalan DEC grant 2014 SGR 86. Part of this paper is based on observations made with the Nordic Optical Telescope, operated by the Nordic Optical Telescope Scientific Association at the Observatorio del Roque de los Muchachos, La Palma, Spain, of the Instituto de Astrofísica de Canarias. This research has made use of the SIMBAD database, operated at CDS, Strasbourg, France. This publication makes use of data products from the Two Micron All Sky Survey, which is a joint project of the University of Massachusetts and the Infrared Processing and Analysis Center/California Institute of Technology, funded by the National Aeronautics and Space Administration and the National Science Foundation. We have made use of the WSRT on the Web Archive. The Westerbork Synthesis Radio Telescope is operated by the Netherlands Institute for Radio Astronomy ASTRON, with support of NWO. We finally thank Valentí Bosch-Ramon (ICCUB) for fruitful discussions on SED interpretation.
References
- Acero, F., Ackermann, M., Ajello, M., et al. 2015, ApJS, 218, 23 [Google Scholar]
- Aharonian, F., Akhperjanian, A. G., Aye, K.-M., et al. 2005, Science, 309, 746 [NASA ADS] [CrossRef] [PubMed] [Google Scholar]
- Albert, J., Aliu, E., Anderhub, H., et al. 2006, Science, 312, 1771 [NASA ADS] [CrossRef] [PubMed] [Google Scholar]
- Berghoefer, T. W., Schmitt, J. H. M. M., & Cassinelli, J. P. 1996, A&AS, 118, 481 [NASA ADS] [CrossRef] [EDP Sciences] [Google Scholar]
- Bohlin, R. C., Savage, B. D., & Drake, J. F. 1978, ApJ, 224, 132 [NASA ADS] [CrossRef] [Google Scholar]
- Condon, J. J., Cotton, W. D., Greisen, E. W., et al. 1998, AJ, 115, 1693 [NASA ADS] [CrossRef] [Google Scholar]
- Cutri, R. M., Skrutskie, M. F., van Dyk, S., et al. 2012, VizieR Online Data Catalog: II/281 [Google Scholar]
- del Valle, M. V., Romero, G. E., Luque-Escamilla, P. L., Martí, J., & Ramón Sánchez-Sutil, J. 2011, ApJ, 738, 115 [NASA ADS] [CrossRef] [Google Scholar]
- Dubus, G. 2013, A&ARv, 21, 64 [NASA ADS] [CrossRef] [Google Scholar]
- Ghisellini, G. 2016, Galaxies, 4, 36 [NASA ADS] [CrossRef] [Google Scholar]
- Hardorp, J., Rohlfs, K., Slettebak, A., & Stock, J. 1959, Luminous stars in the Northern Milky Way (Hamburger Sternw.: Warner & Swasey Obs) [Google Scholar]
- Huang, S.-S. 1972, ApJ, 171, 549 [NASA ADS] [CrossRef] [Google Scholar]
- Hubrig, S., Schöller, M., Fossati, L., et al. 2015, A&A, 578, L3 [NASA ADS] [CrossRef] [EDP Sciences] [Google Scholar]
- Kennicutt, Jr., R. C., Tamblyn, P., & Congdon, C. E. 1994, ApJ, 435, 22 [Google Scholar]
- Kopal, Z. 1959, Close binary systems, International astrophysics series (Wiley) [Google Scholar]
- Landolt, A. U. 1992, AJ, 104, 340 [NASA ADS] [CrossRef] [Google Scholar]
- Martí, J., Luque-Escamilla, P. L., Casares, J., et al. 2015, Ap&SS, 356, 277 [NASA ADS] [CrossRef] [Google Scholar]
- Martí, J., Luque-Escamilla, P. L., & García-Hernández, M. T. 2016, A&A, 586, A58 [NASA ADS] [CrossRef] [EDP Sciences] [Google Scholar]
- McCuskey, S. W., Pesch, P., & Snyder, G. A. 1974, AJ, 79, 597 [NASA ADS] [CrossRef] [Google Scholar]
- Paredes, J. M., Martí, J., Ribó, M., & Massi, M. 2000, Science, 288, 2340 [NASA ADS] [CrossRef] [PubMed] [Google Scholar]
- Paredes, J. M., Bednarek, W., Bordas, P., et al. 2013, Astropart. Phys., 43, 301 [NASA ADS] [CrossRef] [Google Scholar]
- Prša, A., & Zwitter, T. 2005, ApJ, 628, 426 [NASA ADS] [CrossRef] [Google Scholar]
- Rengelink, R. B., Tang, Y., de Bruyn, A. G., et al. 1997, A&AS, 124 [Google Scholar]
- Roberts, D. H., Lehar, J., & Dreher, J. W. 1987, AJ, 93, 968 [NASA ADS] [CrossRef] [Google Scholar]
- Scargle, J. D. 1982, ApJ, 263, 835 [NASA ADS] [CrossRef] [Google Scholar]
- Steele, I. A., Negueruela, I., & Clark, J. S. 1999, A&AS, 137, 147 [NASA ADS] [CrossRef] [EDP Sciences] [Google Scholar]
- Stellingwerf, R. F. 1978, ApJ, 224, 953 [NASA ADS] [CrossRef] [Google Scholar]
- Stroh, M. C., & Falcone, A. D. 2013, ApJS, 207, 28 [NASA ADS] [CrossRef] [Google Scholar]
- Voges, W., Aschenbach, B., Boller, T., et al. 2000, IAU Circ., 7432 [Google Scholar]
- Wilson, R. E., & Devinney, E. J. 1971, ApJ, 166, 605 [NASA ADS] [CrossRef] [Google Scholar]
- Wright, E. L., Eisenhardt, P. R. M., Mainzer, A. K., et al. 2010, AJ, 140, 1868 [NASA ADS] [CrossRef] [Google Scholar]
All Tables
All Figures
|
Fig. 1 Left: the 95% confidence ellipse of the gamma-ray source 3FGL J0133.3+5930 overplotted against the Second Digitized Sky Survey (red) distributed by the Space Telescope Science Institute. The small black and the tiny red circles indicate the positions of the ROSAT and Swift X-ray sources inside the Fermi LAT ellipse, respectively. TYC 3683-985-1 is the brightest star at the edge of the ROSAT circle. Right: same field as it appears in radio at the 20 cm wavelength according to the NVSS. The contour levels shown correspond to −3, 3, 4, 5, 6, 8, 10, 15, 20, 30, 40, 50, 60, 80, 100, 150, and 200 times the rms noise level of 0.4 mJy beam-1. The lower right circle illustrates the NVSS restoring beam with 45′′ FWHM. |
| In the text | |
|
Fig. 2 PDM periodogram of the V-band observations of TYC 3683-985-1 where the statistic Θ displays a very deep minimum for a trial period of 0.97 d, which we interpret as half the true orbital period of the system. |
| In the text | |
|
Fig. 3 UBVRcIc light curves of TYC 3683-985-1 as observed with the UJT and folded using the orbital period value of 1.9402 d reported in this work. The continuous lines correspond to the synthetic light curves generated using the PHOEBE software packages with the physical parameters listed in Table 1. HJD 2 457 378.306 has been adopted as phase origin. All points are plotted twice for easier display. |
| In the text | |
|
Fig. 4 Optical spectrum of TYC 3683-985-1 in the Hα region as observed with the NOT telescope and the FIES instrument. |
| In the text | |
|
Fig. 5 Light curve of the X-ray source Swift J0132.9+5932 inside the 3FGL J0133.3+5930 ellipse showing a clearly variable behaviour on timescales of weeks in the 0.2–10 keV energy range. |
| In the text | |
|
Fig. 6 Combined view of the TYC 3683-985-1 field as observed with the UJT in the VRcIc bands (blue, green and red filters, respectively). The total integration time is about 1 h in each photometric band. The locations of TYC 3683-985-1 and the faint 2MASS object consistent with the Swift J0132.9+5932 X-ray source are marked by yellow lines. The horizontal bar sets the angular scale. North is up and east is left. |
| In the text | |
|
Fig. 7 Optical spectrum of 2MASS 01325529+5932158 obtained with the NOT telescope and its ALFOS instrument on 21 September 2016. The most prominent absorption and emission features are identified. All of them are consistent with the redshift value stated in the text. |
| In the text | |
|
Fig. 8 Shape of the TYC 3683-985-1 stellar components resulting from the PHOEBE parameters in Table 1. The primary and secondary stars are located at the left and right side of the plot, respectively. The secondary star is practically filling its Roche lobe. Axes labels are given in units of the semimajor axis. |
| In the text | |
|
Fig. 9 Dereddened SED of TYC 3683-985-1 from optical to infrared wavelengths (dashed line) built from the UJT magnitudes in the maximum and far-infrared data from the WISE bands (Wright et al. 2010). The thick line has been plotted for comparison purposes. It corresponds to a Kurucz model for an isolated B3V star normalised to the B-band emission level where the free-free excess from the circumstellar disc is almost negligible. |
| In the text | |
|
Fig. 10 Dereddened SED of the X-ray source Swift J0132.9+5932 also consistent with 2MASS 01325529+5932158 and NVSS J013255+593217, which has been proposed as a possible counterpart of 3FGL J0133.3+5930. Data shown include measurements at radio (WENSS and NVSS), near-infrared (2MASS), optical (UJT and NOT), X-ray (Swift) and gamma-ray (Fermi) frequencies. Triangle symbols represent 3σ upper limits for the B- and V-band non-detections with UJT. |
| In the text | |
Current usage metrics show cumulative count of Article Views (full-text article views including HTML views, PDF and ePub downloads, according to the available data) and Abstracts Views on Vision4Press platform.
Data correspond to usage on the plateform after 2015. The current usage metrics is available 48-96 hours after online publication and is updated daily on week days.
Initial download of the metrics may take a while.