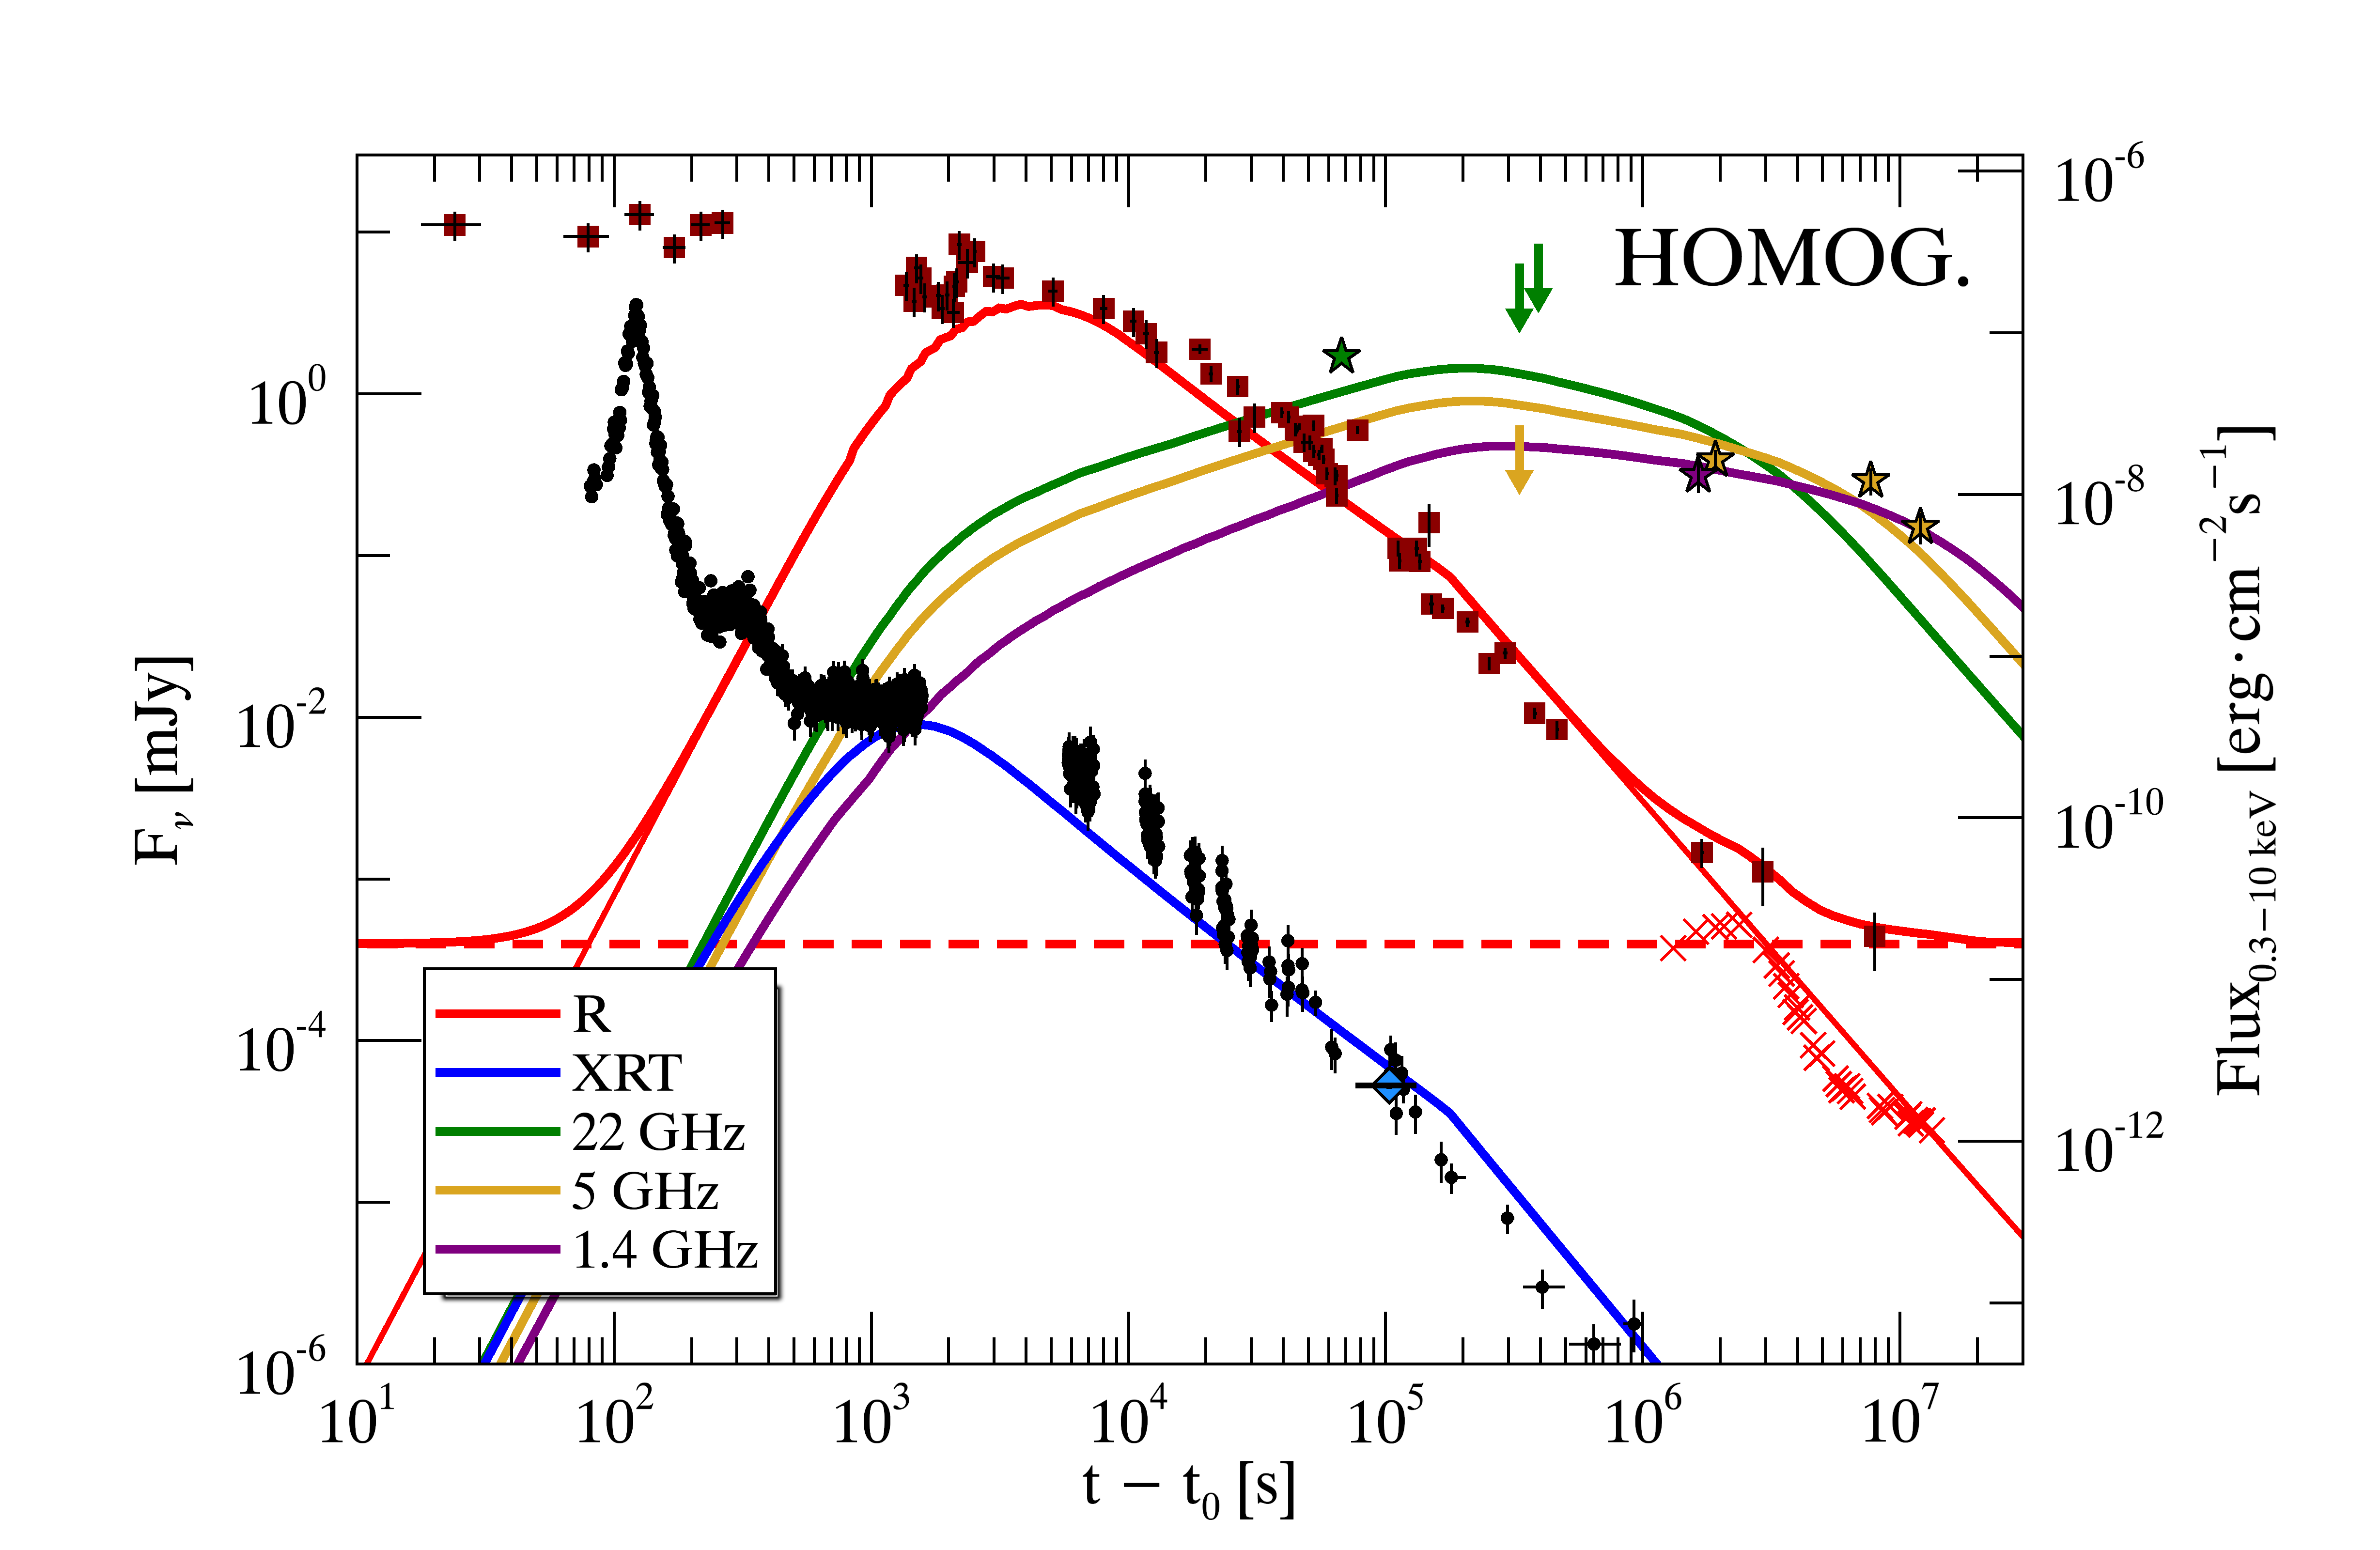
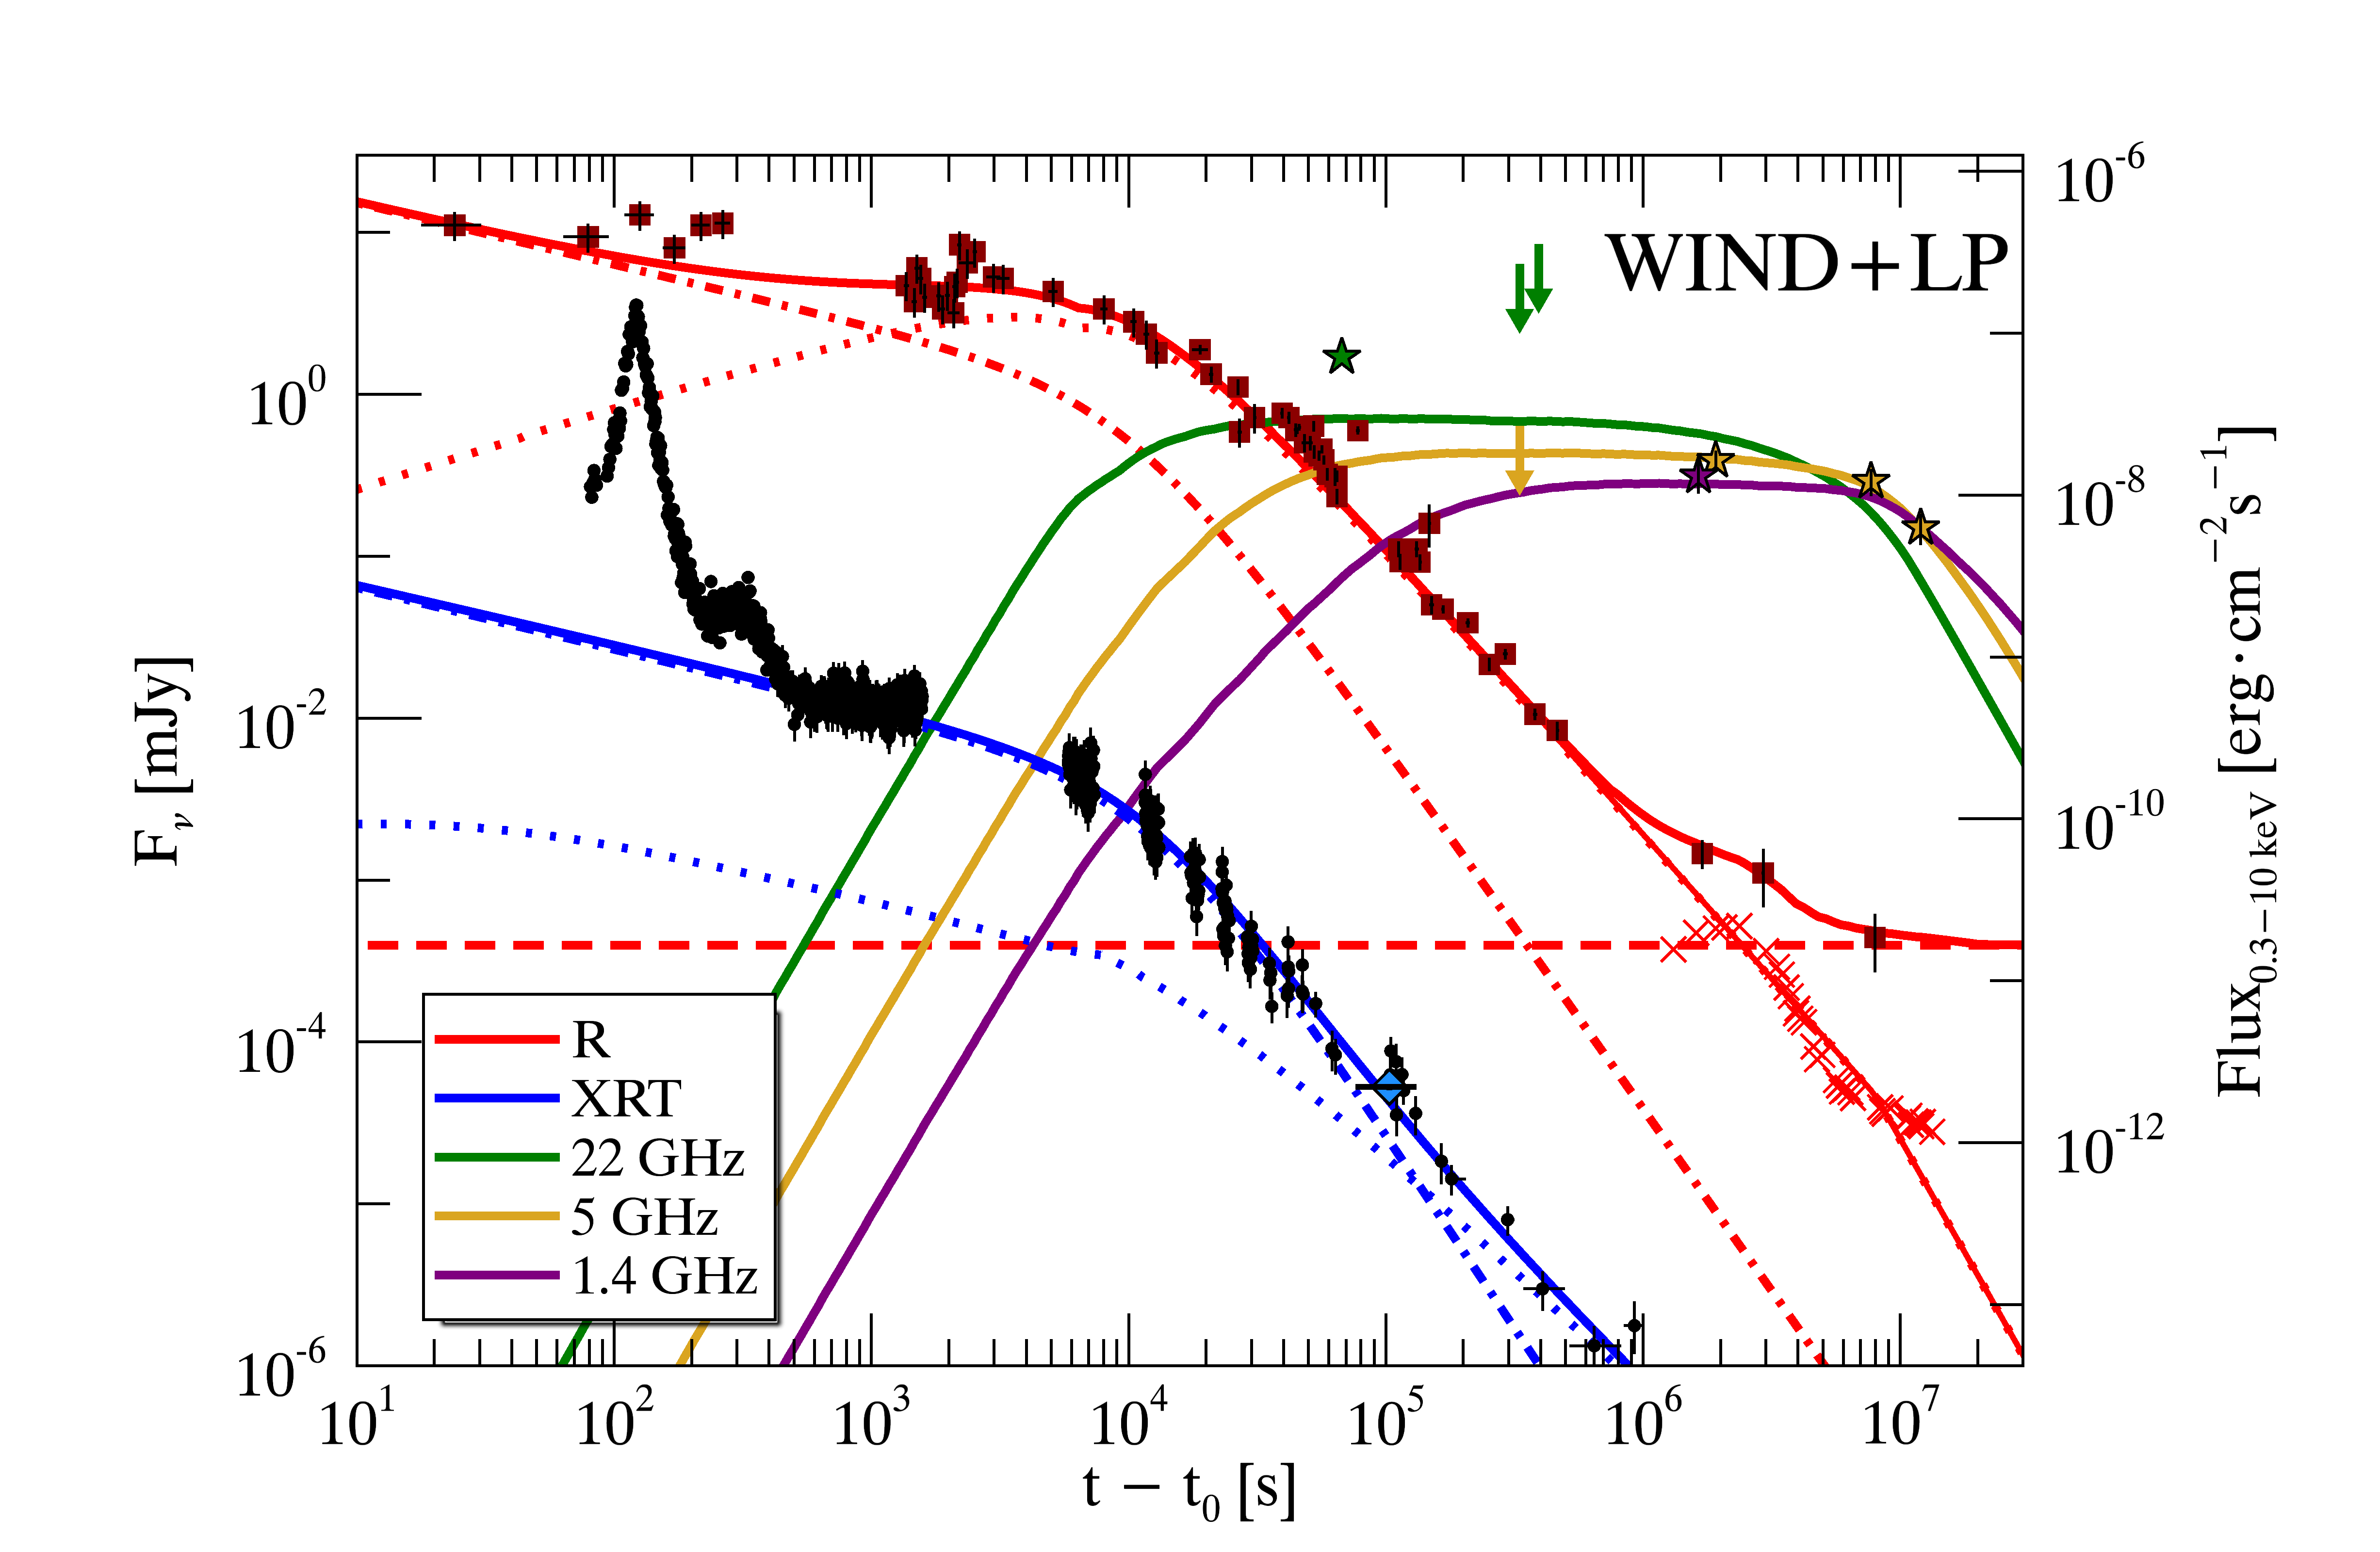
Fig. 6

Multiwavelength light curve of the afterglow of GRB 151027A: XRT flux in band 0.3–10 keV (black circles, blue solid lines referring to the right y-axis), R band flux density Fν (red squares, red solid lines), 22 GHz (green star, green solid lines), 5 GHz radio detections and upper limits (orange stars, orange solid lines) and 1.4 GHz (purple star, purple solid lines). The light blue diamond shows the 0.3–10 keV flux measured by XMM-Newton. The red crosses represent a supernova light curve template obtained by shifting the light curve of SN1998bw at z = 0.81 (Galama et al. 1998; Clocchiatti et al. 2011). The red dashed line shows the estimated R-band flux density of the host galaxy inferred from the LBT observation 92 days after the trigger. The 7 GHz SRT upper limit is shown in orange and compared with the 5 GHz model. The 24 GHz Medicina upper limit is shown in green and compared with the 22 GHz model. Top: best afterglow modelling with a homogeneous external medium. Bottom: best solution in the wind medium scenario in addition to a late prompt component. Dotted red and blue lines represent the afterglow forward shock emission in the R and XRT band, respectively. Dash-dotted lines represent the late prompt component.
Current usage metrics show cumulative count of Article Views (full-text article views including HTML views, PDF and ePub downloads, according to the available data) and Abstracts Views on Vision4Press platform.
Data correspond to usage on the plateform after 2015. The current usage metrics is available 48-96 hours after online publication and is updated daily on week days.
Initial download of the metrics may take a while.