Fig. 7
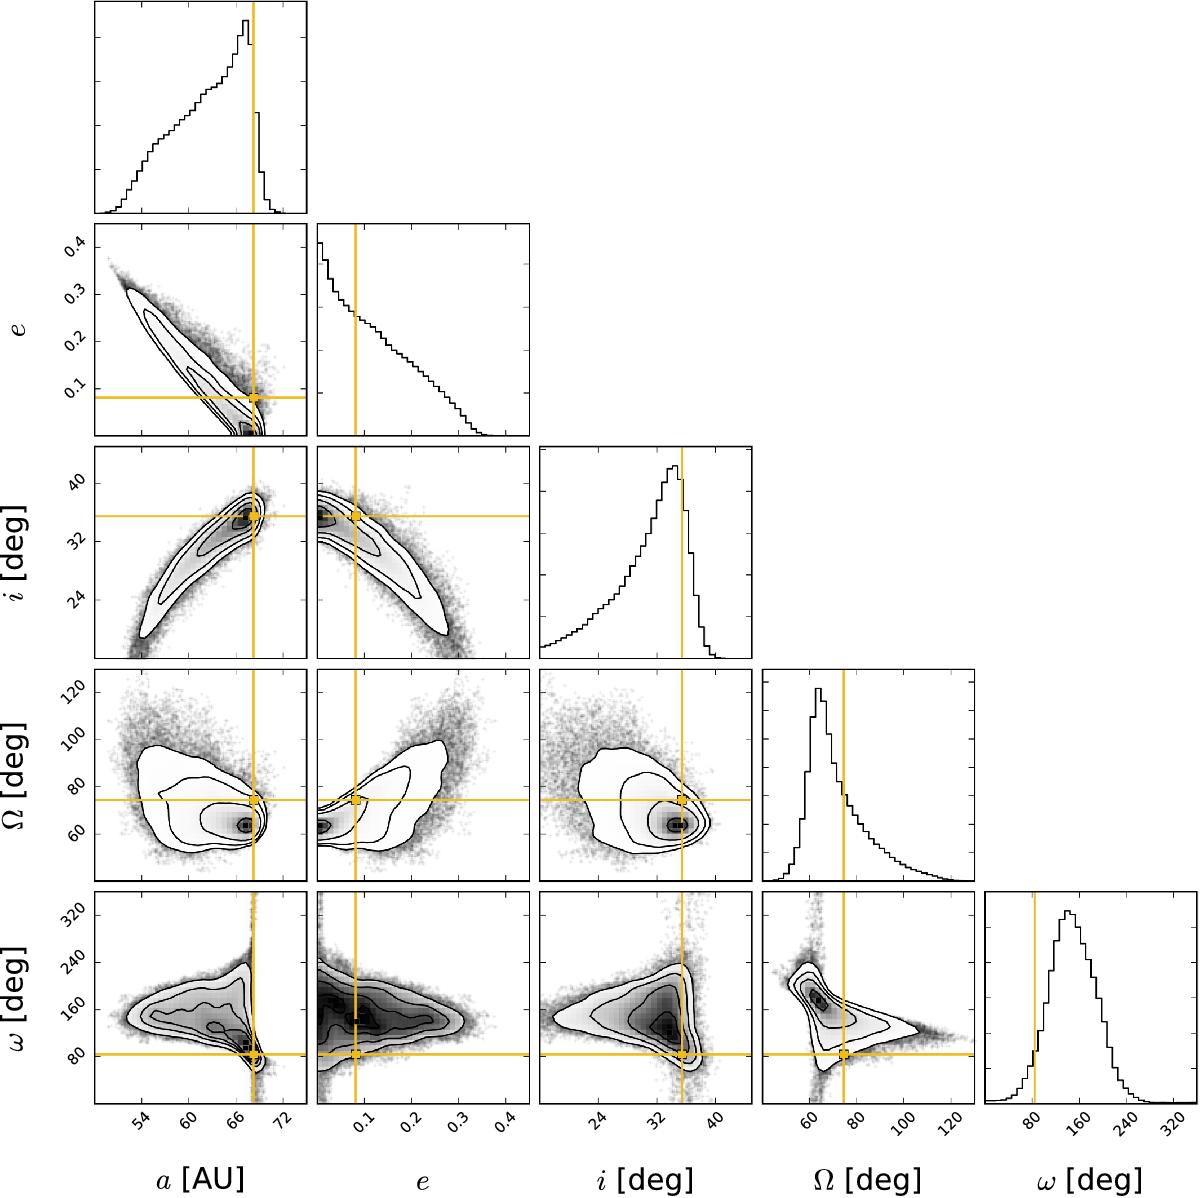
Results of the MCMC simulations for HR8799b, displayed as a corner plot for the Keplerian elements a, e, i, Ω and ω. The diagonal panels illustrate the posterior PDFs while the off-axis panels illustrate the correlation between the parameters. The yellow lines and crosses correspond to the best solution in terms of reduced χ2.
Current usage metrics show cumulative count of Article Views (full-text article views including HTML views, PDF and ePub downloads, according to the available data) and Abstracts Views on Vision4Press platform.
Data correspond to usage on the plateform after 2015. The current usage metrics is available 48-96 hours after online publication and is updated daily on week days.
Initial download of the metrics may take a while.