Free Access
Fig. 1

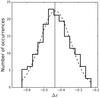
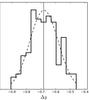
Histogram of the horizontal and vertical offsets of the star with respect to the center of the frame in the December 5 (right) data cube. The vertical line represents the median of the histogram, and was used to globally re-center the data cube. The horizontal axis is in pixels, one pixel corresponding to 12.25 mas on sky.
This figure is made of several images, please see below:
Current usage metrics show cumulative count of Article Views (full-text article views including HTML views, PDF and ePub downloads, according to the available data) and Abstracts Views on Vision4Press platform.
Data correspond to usage on the plateform after 2015. The current usage metrics is available 48-96 hours after online publication and is updated daily on week days.
Initial download of the metrics may take a while.