| Issue |
A&A
Volume 598, February 2017
|
|
|---|---|---|
| Article Number | A95 | |
| Number of page(s) | 9 | |
| Section | Extragalactic astronomy | |
| DOI | https://doi.org/10.1051/0004-6361/201628698 | |
| Published online | 07 February 2017 | |
Formation of satellites from cold collapse
1 Istituto dei Sistemi Complessi, Consiglio Nazionale delle Ricerche, via dei Taurini 19, 00185 Roma, Italia
e-mail: This email address is being protected from spambots. You need JavaScript enabled to view it.
2 Laboratoire de physique nucléaire et de hautes énergies, University Pierre et Marie Curie, 4 place Jussieu, 75005 Paris, France
3 Museo Storico della Fisica e Centro Studi e Ricerche Enrico Fermi, via Panisperna 89 A, Compendio del Viminale, 00184 Rome, Italy
4 Istituto Nazionale Fisica Nucleare, Unità Roma 1, Dipartimento di Fisica, Universitá di Roma “Sapienza”, Piazzale Aldo Moro 2, 00185 Roma, Italia
Received: 12 April 2016
Accepted: 3 December 2016
Abstract
We study the collapse of an isolated, initially cold, irregular (but almost spherical) and slightly inhomogeneous cloud of self-gravitating particles.The cloud is driven towards a virialized quasi-equilibrium state by a fast relaxation mechanism, occurring in a typical time τc, whose signature is a large change in the particle energy distribution. Post-collapse particles are divided into two main species: bound and free, the latter being ejected from the system. Because of the initial system’s anisotropy, the time varying gravitational field breaks spherical symmetry so that the ejected mass can carry away angular momentum and the bound system can gain a non-zero angular momentum. In addition, while strongly bound particles form a compact core, weakly bound ones may form, in a time scale of the order of τc, several satellite sub-structures. These satellites have a finite lifetime that can be longer than τc and generally form a flattened distribution. Their origin and their abundance are related to the amplitude and nature ofinitial density fluctuations and to the initial cloud deviations from spherical symmetry, which are both amplified during the collapse phase. Satellites show a time dependent virial ratio that can be different from the equilibrium value b ≈ −1: although they are bound to the main virialized object, they are not necessarily virially relaxed.
Key words: methods: numerical / galaxies: elliptical and lenticular, cD / galaxies: formation
© ESO, 2017
1. Introduction
The characterization of the collapse of an isolated cloud of self-gravitating particles represents an important theoretical problem that can be relevant for the comprehension of the formation of astrophysical relaxed objects, for instance globular clusters and galaxies. It has been known, since the first numerical simulations, that when an isolated self-gravitating particle system is initially cold, it collapses violently and then it relaxes to produce a virialized quasi-equilibrium state on a relatively short time scale (Henon 1964). While the collapse of a uniform spherical cloud was the case mostly studied in the literature (see e.g. Aarseth et al. 1988; Boily et al. 2002 and references therein), many authors have focused on spherical models with non-trivial density profiles and/ or with significant non-zero velocities (see e.g. van Albada 1982; McGlynn 1984; Villumsen 1984; Aguilar & Merritt 1990; Theis & Spurzem 1999; Merrall & Henriksen 2003; Roy & Perez 2004; Boily & Athanassoula 2006, and references therein).
A crucial parameter determining the cloud evolution after the collapse isthe initial virial ratio, b(0) = 2K/W, i.e. the ratio between twice the kinetic energy K and the gravitational potential energy W. When the cloud is cold enough (i.e. b(0) → 0) it can change its size by a relevant factor, passing hence through a phase of fast relaxation whose signature is represented by a large change of the particle energy distribution P(ep). Initially all particles had negative energy, but after the collapse two different species of particles arise: bound particles and free particles (David & Theuns 1989; Theuns & David 1990; Joyce et al. 2009; Sylos Labini 2012). Bound particles, with energy ep ≪ 0, form the core of the virialized object; weakly bound particles, with energy ep ≤ 0, form the large radii tail of the virialized object; free particles, with energy ep> 0, can escape from the system. On the other hand, when the cloud is initially warm enough (i.e. b(0) → −1) it slightly rearranges its phase-space distribution in order to reach a quasi stationary state without ejecting mass and energy (see e.g. Sylos Labini 2012, and references therein).
The fast relaxation mechanism is associated with a number of interesting features. Beyond the ejection of mass and energy from the system it is possible to observe the formation of a virialized quasi-stationary state with universal density and velocity profiles. This occurs because of the strong gravitational field generated during the collapse washes out the dependence from initial conditions (Sylos Labini 2013). Several authors (e.g., Merritt & Aguilar 1985; Aguilar & Merritt 1990; Theis & Spurzem 1999; Boily & Athanassoula 2006; Barnes et al. 2009; Sylos Labini et al. 2015) have studied how the initial spherical symmetry breaks up in consequence of the collapse. Recently, Worrakitpoonpon (2015) and Benhaiem et al. (2016) have found that the virialized state may have a non-zero angular momentum. Indeed, together with mass and energy, ejected particles can carry away angular momentum if spherical symmetry is broken during the gravitational collapse.
Beyond the case of a spherical cloud of self-gravitating particles, we have studied the dynamics of the cold collapse by using initially cold and slightly ellipsoidal cloud (Benhaiem & Sylos Labini 2015). This system was chosen because it represents a relatively simple configuration for determining the effects of the deviations from spherical symmetry during the cold collapse. While the main characteristics of the virialized object are very similar to the spherical cloud case, we found that ejected particles are characterized by highly asymmetrical shapes, whose features can be traced in the initial deviations from spherical symmetry that are amplified during the cold collapse phase. Ejected particles can indeed form flattened configurations even though the initial cloud was very close to spherical. Furthermore, we found that ellipsoidal clouds with a sufficiently large initial degree of spatial anisotropy (i.e. the ratio between the largest and smallest semi-axis lower than ≈0.8) may give rise to the formation of satellite substructures that are not ejected from the system and that ultimately fall back onto the main virialized object. In addition, these substructures are found to follow the same spatial distribution of the ejected particles and thus form flattened configurations.
This observation motivated the present paper where we consider more inhomogeneous initial conditions aiming to determine how these might favour the formation of satellite substructures during a cold collapse. We thus consider here the collapse of isolated, cold, irregular (but almost spherical), slightly inhomogeneous self-gravitating clouds. We have performed some numerical experiments by using similar initial conditions to those ofvan Albada (1982); here we study in greater detail the morphology of the aggregates of bound particles that are formed after the collapse and the formation of satellite substructures and a number of other interesting physical features, thanks to much more powerful computational means.
The paper is organized as follows. In Sect. 2 we illustrate the simulations that we performed, giving details on the generation of the initial conditions, the numerical codes, and algorithm used to identified the satellites. The main results of our numerical experiments are presented in Sect. 3. Finally in Sect. 4 we draw our main conclusions.
2. Simulations
2.1. Generation of initial conditions
The weakly inhomogeneous and slightly non-spherical particle distributions used as initial conditions are generated as follows. We randomly place Nc points in a sphere of radius R0. Each of these particles is taken to be the centre of a spherical cloud of Np particles, where for each case the number Np is extracted from a uniform distribution with average μ and variance σ. The expected total number of particles is thus N = Nc × μ. The Np particles are randomly distributed in each subcloud that is taken to be spherical and with radius lc; this is a free parameter that can be adjusted as explained below. All particles have the same mass m and the initial cloud density is approximately  (1)because the initial system is close to spherical as long as lc<R0. Similarly the collapse time1 of the whole cloud is the similar to that of a perfectly spherical one with density ρ0, i.e.,
The radius of each subcloud lc is fixed to be larger than the average distance between subclouds centers  (2)In this way the different subclouds may substantially overlap so that the resulting density distribution does not have large fluctuations (i.e. there are no empty regions). The collapse time of each subcloud, if it is isolated, is
  where
where  . When lc> Λc we find τp>τc, i.e. the collapse of the whole cloud occurs before than the collapse of each subcloud. This means that the mean field of the inhomogeneous and non-spherical cloud drives the dynamics of the monolithic collapse of the whole system.
Instead, when lc< Λc the collapse of the subclouds is faster than that of the whole cloud, i.e. τp<τc. However, in this case the initial distribution ishighly inhomogeneous; each spherical subcloud collapses independently of all the others,forming a virialized state that may eventually merge with the others, giving rise to a hierarchical bottom-up aggregation process. Here we limit our study to the case of weakly inhomogeneous systems that give rise to monolithic collapses,and thus we fix lc ≥ Λc in all our simulations.
In order to characterize a generic structure shape we define three different linear combinations of the three eigenvalues λi (i = 1,2,3, defined as λ1 ≥ λ2 ≥ λ3) of the inertia tensor (Binney & Tremaine 1994): the flatness parameter  (3)the triaxiality index
  (4)and the disk parameter
  (5)The combination of ι,τ and φ makes it possible to distinguish not only between different types of ellipsoids (prolate, oblate and triaxial) but also between other shapes like bars and disks (Benhaiem & Sylos Labini 2015). In Table 1 we give their values for somecases that are representative of the range of parameters we explore in our numerical experiments.
Values of the parameters ι,τ,φ for known shapes.
Then, in Table 2 we show the details of the simulations we have run.
We emphasize that the initial velocity dispersion was set to zero, i.e. we considered perfectly cold initial conditions. As discussed in Sylos Labini (2012) a monolithic collapse occurs as long as the initial velocity dispersion is small enough, i.e. for an initial virial ratio such that  (6)where K(W) is the initial total kinetic (potential) energy. Indeed if the initial velocities are larger the monolithic collapse is no longer violent, i.e. the particle energy distribution does not change in a relevant way. As we discuss below, the generation of satellites is instead related to a large particle energy change during the collapse and for this reason we consider only cold initial conditions. In particular we take the initial virial ratio to be b = 0.
Properties of inhomogeneous cloud simulations.
2.2. Numerical details
In order to run gravitational N-body simulations we used the N-body code Gadget-2 (Springel et al. 2001, 2005; without the Fourier transform part that is unnecessary for an isolated system). All results presented here are for simulations in which energy is conserved to within a few tenths of a per cent over the time scale evolved, with maximum deviations at any time of less than half a per cent. This accuracy was attained using values of the essential numerical parameters in the Gadget-2 code 0.025 for the η parameter controlling the time-step, and a force accuracy parameter of αF = 0.001, that is in the range of typically used values for this code. We also performed extensive tests of the effect of varying the force smoothing parameter ε, and we found that we obtain very stable results provided it is significantly smaller than the minimal size reached by the whole structure during collapse. Our simulations are performed with open boundary conditions and in a non-expanding background. Thus, beyond energy conservation, we can also monitor linear and angular momentum conservation to test the accuracy of the numerical integration. Simulations are run up to ~20τc, which is a long enough time range to study the structures emerging from a monolithic collapse, and it requires long calculations, in particular for simulations with >105 particles. Indeed, on such a time scale the structure formed from the monolithic collapse has sufficient time to relax to a quasi-stationary state which has almost time-independent properties (Sylos Labini 2012). Then there are still two main sources of the further evolution taking place at longer times. On the one hand, the bound satellites orbiting around the main structure may cross it once or several times unitl they are destroyed by tidal interactions. As mentioned above, such a dynamical process can take a very long time. On the other hand, two-body collisions will cause a slow evaporation of the virialized object on a typical time scale of the order of N/ log (N)τc, i.e. very much longer than the time scale we have explored.
2.3. Satellites identification
As mentioned above, after the cold collapse phase in all cases we detect the formation of satellites, i.e. aggregates of particles that can be self-bound, at least for a finite time, and that are bound to the main object that contains most of the particles. In order to identity these substructures in the simulations, we have developed a simple algorithm, which is inspired by the spherical overdensity algorithms, usually used in cosmological simulations to find what are known as “sub-halos” (see Onions et al. 2012 and references therein). This algorithm has been extensively tested both against some artificial configurations that we used as toy models and against the gravitational simulations we have run. In particular, we have checked that the satellites identified by the algorithm correspond to those that we visually identify and that these are very robust to the change of the possible numerical parameters of the code, i.e. consistent with respect to the possible arbitrary choices of the different numerical values used by the algorithm.
Our algorithm finds satellite substructures in a certain snapshot of a given run. As long as satellites are sufficiently far away from the largest virialized object, the results are very weakly dependent on the time chosen, which in general does not exceed 5 ÷ 10τc. The code firstly identifies the position of the main object and the particles that belong to it. To this end, we compute the potential energy of each particle and we define the centre of the main object as the particle with the minimum of the gravitational potential energy. Starting from this point we compute the radial gravitational potential’s profile of the whole distribution. If there are no substructures, the potential should smoothly decay from the object’s centre.
We define the radius of the main object as the radius rmo at which we observe either that the absolute value of the radial potential increases over two consecutive radial bins or that the mean density at rmo is equal to a certain density threshold. For instance, we use ρthresh = 0.1ρ0, where ρ0 is the initial density of the structure (see Eq. (1)). We then tag all the particles within this radius as belonging to the main object; they are then stored and put aside from the subsequent calculations. This procedure is repeated iteratively: we first remove all the particles belonging to the main object and then we compute again the potential of all remaining particles. We then find the next minimum of the gravitational potential, and we use the same procedure illustrated above to find the radius of the satellite. We tag the particles belonging to the first satellite accordingly and remove it from the next calculation. We proceed in this way until a satellite has a number of particles below the threshold that we set equal to Nmin = 100: at this point the extraction of the satellites is stopped.
We tested different values of ρthresh to find the best one for a given simulation. Indeed, a density threshold that is too high artificially reduces the size of the main object, thus leading to the false identification of particles as belonging to a satellite while they are in reality embedded in the main object itself. On the other hand a too small density threshold would include also escapers particles as satellites. Instead, we tune the density threshold to detect satellites with a sufficient number of particles and dense enough that they can survive a few dynamical times; we then checked very carefully by visual inspection (and by checking that the particles identified as belonging to a satellite remain mostly the same at different times) that this was indeed the case.
After the identification of the main object and of its satellites, we proceed with the analysis to characterize their properties. First, we compute both the density and the velocity profiles. Then we estimate their virial ratio bs = 2Ks/Ws, where Ws is computed by considering only the particles of each (sub)structure and Ks is computed in the centre of mass rest frame. Further we compute their angular momenta and we characterize their shapes by measuring the parameters ι,τ and φ (see Eqs. (3)–(4)).
In addition, we compute the equation of the plane identified by the major and minor semi axis of the main object and then we compute the distance of the satellites from this plane. In this way we can easily determine the angle between the satellite centre of mass and such a plane. This measurement allows us to understand whether the satellites form a flattened distribution.
2.4. Effects of the initial inhomogeneities on the demographics of the satellites
The relation between the characteristics of the initial spatial configurations, for example the number of subclouds and the degree of anisotropy, and the number of satellites formed after the monolithic collapse of the cloud is not regulated by a few simple macroscopic parameters. Indeed, we cannot detect a correlation between the number of satellites detected after the collapse with the initial number of subclouds nor with the the initial values of the structure parameters ι,τ and φ (see Table 2).
In addition, we have tried to assess the role played by the initial density inhomogeneities in determining the final number of satellites formed after the monolithic collapse by applying the satellite finding algorithm to the initial conditions. Even in this case we do not detect any correlation as the algorithm that we used for the analysis of the evolved snapshots does not identify any satellite in the initial conditions. This occurs because the code identifies a satellite if this is a well-defined and isolated object while the initial conditions we considered are instead sufficiently uniform and do not contain such objects. As discussed below, the formation of satellites is driven by a non-trivial combination of the roles of the initial density fluctutations and of the initial spatial anisotropy and for this reason, for small deviations from uniformity and spherical symmetry, there is not a simple a definite initial characteristic of the cloud which can be correlated with the number of post-collapse satellites.
3. Results
We first focus on some global properties of a typical simulation. As can be seen in Fig. 1 (upper panel) the total energy is conserved up to 0.2%, with an absolute maximum at the time of global collapse of the system, which corresponds to a deviation of 0.6%. This is in line with the fact that the numerical integration is more difficult when the density is higher; however, collisions do not represent a major issue because the typical time scale for two-body relaxation is much larger than the duration of the collapse phase τc. The difference between the virial ratio of all particles and that of all bound particles is due to the ejection of mass from the system, which is very small in the typical case we consider in this paper (see the bottom panel of Fig. 1).
 |
Fig. 1 Simulation C1. Upper panel: total energy. Bottom panel: virial ratio of all particles (solid line) and of bound ones (dashed line). |
We first concentrate our study to the properties of the main object, extracted through the procedure described in Sect. 2.3, then we analyse the weakly bound particles surrounding the main structure. Finally, we investigate the properties of the satellites and how they are distributed.
3.1. Main virialized object
The largest virialized object is in a quasi-stationary state for t >τc and it is almost triaxial because we find φ ≈ 1/2 and τ ≈ 0.2 being ι ≈ 0.4 (see Fig. 2). Figure 3 shows the density profile that shows a power-law tail decaying as r-4 (left panel) and the radial velocity dispersion profiles that shows a tail decaying as r-1 (right panel).
 |
Fig. 2 Simulation C1. Upper panel: behaviour of the shape parameters ι,φ,τ for the more 60% highly bound particles of the largest virialized structure. Bottom panel: behaviour of the gravitational radius. |
 |
Fig. 3 Simulation C1. Left panel: density profile (the solid line is a power law with an exponent −4). Right panel: radial velocity dispersion profile (the solid line is a power law with an exponent −1). |
During the collapse, all particles move almost radially towards the centre, up to the arrival time when their velocity is mostly directed outwards: particles have different arrival times depending on their initial position. For inhomogeneous and non-spherical clouds the spread of arrival times is much larger than in the case in which the initial condition was either spherical or slightly ellipsoidal. In the spherical case the spread of arrival times can be tuned by changing the initial density profile shape: the minimal spread occurs for the case of a uniform density profile. On the other hand, when the initial density profile is power law, or when it has more complicated behaviours, then the arrival time spread can be that particles initially inthe most external shells arrive at the centre when the particles, that are initially in the internal shells, are already re-expanding. It is the motion in a rapidly varying potential that allows these particles to gain kinetic energy (see Joyce et al. 2009, for a quantitative discussion of this phenomenon), causing a large variation in the particle energy distribution P(ep). In particular, this occurs if the cloud’s minimal gravitational radius (in units of the initial one) is  (7)where W(t) is the gravitational potential energy at time t (see the bottom panel of Fig. 2). This criterion was also found to hold when the initial cloud has a uniform density profile but an ellipsoidal shape (with ι(0) ≤ 0.25; see Benhaiem & Sylos Labini 2015) and it works well also in the case of the simulations presented hereafter.
 |
Fig. 4 Ratio between the minor and major eigenvalue of the weakly bound particles (WBP) at time >τc and of the initial cloud (IC) in the different runs. |
3.2. Weakly bound particles
As mentioned above, the collapse of a slightly inhomogeneous and weakly non-spherical cloud presents features in common with both initial spherical and ellipsoidal ones. In particular, in the simulations we have performed, we find that a large fraction of the mass collapses in a small time interval around τc and then the more external shells collapse with a large spread of arrival times. In this situation, because spherical symmetry is already broken in the initial conditions, not only is there a large variation of individual particle energies but other interesting features also arise such as an asymmetric ejection of mass and the formation of a flattened configuration of weakly bounded particles. In addition we find that some of these weakly bounded particles aggregate into satellite substructures while others may form time-dependent configurations like streams, jets and rings.
The flattening of the weakly bound particles distribution is shown by comparing the behaviour of the ratio between the minor and major eigenvalue at time t∗>τc with that of the initial cloud (see Fig. 4). As mentioned above, a few dynamical times after the monolithic collapse the majority of the bound particles relax to a quasi-stationary state whose properties change over a very long time scale that is much longer than what we consider in our numerical experiments. Indeed in Figs. 1–2 it is possibile to see that the macroscopic characteristics of the structure are almost time independent. Therefore, for most of the particles the ratio between the minor and major eigenvalue is time independent. On the other hand, a fraction of the bound particles, those with energy close to zero, still evolve after the collapse for a time which depends on their energy and can be much longer than the time scale of our simulations. We have controlled that in the time range 5−20τc the ratio between the minor and major eigenvalue does not change significantly and thus we report the measurement of this ratio at 10τc.
As can be seen from Fig. 4, the initial condition was close to spherical in all cases while the distribution of weakly bounded particles after the collapsebecomes asymmetrical. Satellites, being a subsample of the weakly bound particles, are clearly part of the flattened distribution.
As mentioned above, the collapse of an ellipsoidal cloud is characterized by a mechanism of energy gain that amplifies the initial small deviations from spherical symmetry (Benhaiem & Sylos Labini 2015). This interpretation is supported by the fact that the largest semi-axis (i.e. λ3(0)) of the initial cloud is parallel to that of bound particles in the virialized state and to that ejected particles. For inhomogeneous clouds the situation is similar; to show that this is the case, we consider the angle Ψ between λ3(0) and the vector  , i.e. the smallest eigenvalue of the virialized object at t>τc. Furthermore, we measure the angle Φ between λ3(0) and the vector
  that is in the direction of the largest semi-axis of the weakly bound particles after the collapse. Although the statistics are not very robust (have only 23 runs), Fig. 5 shows that the probability density function for both Ψ and Φ are both peaked at small angles. This implies these axes are parallel to each other which fact corroborates the interpretation that the initial asymmetry is amplified during the collapse phase and that it leaves an imprint in the final particle distribution.
 |
Fig. 5 Probability density function of the angles Ψ and Φ (see text for details). |
3.3. Satellites
We show in Fig. 6 the evolution at different times of two satellites formed in a typical simulation. The satellites were identified at t = 7τc , when they have approximately reached the maximum distance from the largest virialized object, and then their evolution was traced backward and forward. It is possible to see that particles belonging to the satellites were located, at t = 0, in a contiguous region in the outer shell of the initial cloud. These substructures are initially not self-bound and remain bounded to the main virialized object during their evolution: their particles have negative, but close to zero, total energy. During the cold collapse phase the sub-set of particles later forming these substructures can gain some kinetic energy, even though not enough to escape from the system. Any given satellite reaches the greatest distance allowed by its kinetic energy and then it starts to collapse towards the main object, which has already relaxed into a virialized quasi-equilibrium state in a short time around τc. When a certain satellite approaches the main virialized object, it moves in a varying gravitational potential and thus its total energy is not conserved.
 |
Fig. 6 Evolution at different times (see labels –; times are given in units of τc) of two satellites of a typical simulation (C1; distances are given in units of the initial cloud radius R0). The two satellites considered here are on opposite sides of the largest virialized object and have different return times. |
Particles belonging to satellites are those which are weakly bounded after the collapse as shown by their energy distribution (see Fig. 7).
 |
Fig. 7 Energy distribution of all particles (black) and of the particles belonging to the two satellites of the simulation C1 (the colour code of the satellites is the same as in Fig. 6) at t = 4τc of a typical simulation. (The energy is given in units of e0 = GNm2/R0.) |
This situation implies that the return time τr2 of the satellite could be, in principle, arbitrarily long when a particle’s energy is close to zero, i.e. ep → 0− then we have τr → ∞.
The satellite’s virial ratio (see the upper panel of Fig. 8) is computed by considering the contribution to the potential and kinetic energy of those particles identified as belonging to the satellite in the manner described above; clearly, particles’ velocity is computed with respect to the satellite centre of mass rest frame. The time τmax of maximum distance from the main object centre corresponds to when the velocity of the satellite center of mass is close to zero (see the middle panel of Fig. 8).
From the analysis of Fig. 8, and of the analogous behaviours for other satellites formed in the set of 23 simulations, we can deduce that the satellites form at the collapse time of the whole cloud: this is shown by the local maximum near the time of collapse of the time evolution of the virial ratio and of the flatness parameter of the different satellites which then rapidly stabilize for a certain amount of time. In addition, for the case of one satellite (shown in Fig. 8 by the red solid line) these quantities are almost constant up to ≈12τc when the satellite merges with the main structure. Instead, the other satellite (green dashed line in Fig. 8), having a smaller energy (as shown by Fig. 7), has a return time longer than 20τc and thus it is still moving away from the main structure when the simulation is stopped.
 |
Fig. 8 Upper panel: evolution of the absolute value of the virial ratio for two different satellites of simulation C1. Middle panel: velocity of their centre of mass in the rest of frame the main structure. Bottom panel: behaviour of ι100, i.e. the flatness parameter for all bound particles. |
From the measured behaviours we note that when a satellite does not display a shape roughly close to spherical (i.e., ι ≤ 1 – see the bottom panel of Fig. 8), its virial ratio is far from the equilibrium value b ≈ −1. Instead, a satellite may reach a virialized configuration only when it is farthest from the main object – corresponding to the smallest tidal influence. Therefore a satellite’s particles, although they are close together, may not be physically bound and virially relaxed; instead, they arelocated close to each other because they were so initially and they have remained close during the whole evolution considered.
A satellite might cross the largest virialized object on or more times before being totally destroyed by tidal interactions. In this situation, the satellite’s particles move once again in a rapidly varying gravitational field, and they can gain enough energy to escape from the system thus causing a secondary ejection (see Fig. 9).
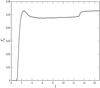 |
Fig. 9 Fraction of ejected particles as a function of time for the simulation C1. The first secondary ejection, due to arrival of the first satellite to the main object, is clearly visible at t = 13τc. |
Figure 10 shows the histogram, over all satellites in all the simulations we have run, of sin(θ), where θ is the angle between the plane identified by the two largest semi-axes of the main object and the line passing from the main structure centre to the satellite centre. This figure clearly shows that the satellites are planar distributed, and specifically that they lie in the plane defined by the the two major axes of the main structure. This is, however, perfectly coherent with the process we have discussed above as the final major and medium axes of the main structure are aligned with the initial axis, and ejection occurs preferentially in the direction of the major axis. It is therefore the position where the probability of forming a satellite is highest.
 |
Fig. 10 Probability of sin(θ) where θ is the angle between the plane identified by the two largest semi-axes of the main structure and the line passing through the main structure centre and the satellite centre. |
3.4. Angular momentum
As mentioned above, one of the main features of the cold collapse phenomenon is that a significant fraction of the system particles may gain enough kinetic energy during the collapse phase to be ejected from it (Joyce et al. 2009). In addition because the gravitational field breaks spherical symmetry, the ejected mass can potentially carry out angular momentum. In Benhaiem et al. (2016) for initial configurations in which spherical symmetry was broken only by the Poissonian fluctuations associated with the finite particle number N, we found that the relaxed structures have standard spin parameters λ ≈ 10-3 decreasing slowly with N. The parameter λ is defined as (Peebles 1969)  /
/ where
where  /
/ Mb is the bound mass, Eb (Wb) the total (gravitational potential) energy of this mass (with respect to its centre of mass), and
  the angular momentum of the bound mass. For prolate ellipsoidal initial conditions, with ι(0) ≤ 0.15, we have measured values that are one order of magnitude higher i.e. λ ≈ 10-2, which is of the same order of magnitude as those reported for elliptical galaxies (see Benhaiem et al. 2016, and references therein). Naturally, this mechanism of angular momentum generation can be amplified when the initial distribution is already not spherically symmetric. Indeed, we found in our simulations that the typical value of the angular momentum is about λ ≈ 10-2 for the main virialized object (see Fig. 11), although in some cases it can reach λ ≈ 7 × 10⁻². It is important to note that, while we compare our data with angular momentum measured in cosmological simulations or observational galaxies, we do not claim that the process we describe is the one taking place in this context. We compare them only in order to stress that the generation of angular momentum by cold collapse can sometimes be as effective, depending on the initial configuration.
 |
Fig. 11 Standard spin parameter (see text) of the main virialized object in all the different runs. |
4. Conclusions
As in the case of simpler initial conditions, such as a cold spherical cloud, we find that, after the collapse there are two species of particles, identified by their energy. However for the cases considered here we find that, while strongly bound particles are found in the main structure core as in the case of simpler initial conditions previously considered, only a small fraction (i.e. less than 20%) of the total mass is ejected. In addition we find that bound particles with energy ep → 0− may form satellite substructures with finite lifetimes that can be orders of magnitude larger than the typical time scale τc of cold collapse phase.
These satellites are part of the flattened distribution made of weakly bound particles that originates from the amplification of the initial small deviations from spherical symmetry. Furthermore, the satellites lie preferentially on a plane that is oriented as the plane defined by the two major semi-axes of the main structure, thus reflecting the initial asymmetry of the cloud. Their virial ratio is time dependent; we observed that satellites with almost spherical shape have virial ratios close to b ≈ −1 when they are sufficiently far away from the largest virialized object, while satellites with irregular shapes have virial ratios that can be substantially different from the equilibrium value and are typically subjected to large tidal effects.
Our numerical experiments are greatly simplified with respect to cosmological simulations and, in particular, they do not consider any baryonic physics which is generally considered the mechanism that explains the formation of a disk. Nevertheless, we note that we have found an interesting and novel result, namely that a purely gravitational system may give rise to a flattened distribution of satellites. It is important to stress that satellites formed during the cold collapse phase have a different dynamical history to those formed in CDM simulations and have a different set-up of the initial conditions from typical cosmological initial conditions. Indeed, in the former case structure formation proceeds through a bottom-up, i.e. hierarchical, clustering process in which larger and larger objects coalesce. Instead, satellites produced by a cold collapse are formed at the same time as the main virialized object τc through a monolithic collapse of the whole cloud. Their lifetimes depend on their energy gain during the strong collapse phase and can be much longer than the cold collapse typical time scale. Then satellites are typically formed in opposite directions, thus showing a kinematic correlation, i.e. a correlated or anti-correlated radial velocity – depending on whether satellites are moving outwards or inwards. Soon after the monolithic cold collapse at the time τc all satellites should be moving outwards while at later times there can be satellites moving in both directions.
We have noticedthat satellites formed from a cold collapse are not necessarily at virial equilibrium: they can be,in a certain period of their lifetime, at virial equilibrium,but in our simulation we have found that this occurs only when they are far from the main virialized object. Otherwise, even though satellite’s particles are found in a small localized spatial region, they are not self-bound. In general a relevant fraction of the bound particles, those which have energy close to zero, are not at virial equilibrium. This can be relevant for kinematical mass estimation and it will be studied in more detail in a forthcoming work.
Finally, during the cold collapse a self-gravitating system may eject a significant fraction of its mass. As we discussed in Benhaiem et al. (2016) if the time varying gravitational field also breaks spherical symmetry this mass can potentially carry angular momentum. In this way starting from initial almost spherical configurations with zero angular momentum can, in principle, lead to a bound virialized system with non-zero angular momentum. We have shown in this paper thatmomentum generation is even amplified in the situation in which the initial distribution is not already spherically symmetric. Furthermore, we have noted that the collapse of the satellites into the main structure can also lead to an increase in the angular momentum of the main object.
Despite these interesting features it is still an open problem to establish in which conditions a cold collapse might occur in the cosmological context and/or if it does it at all. Indeed, complex physical processes such as baryonic physics and merging between structures are not taken into account in this simple study.
In our units ρ0 = 1 gr/cm3 and thus τc = 2100 s.
The time that the satellite takes to cross the main structure after its ejection.
Acknowledgments
We thank Michael Joyce and Tirawut Worrakitpoonpon for useful discussions and comments. Numerical simulations have been run on the Cineca Fermi cluster (project VR-EXP HP10C4S98J) and on the HPC resources of The Institute for Scientific Computing and Simulation financed by Region Île de France and the project Equip@Meso (reference ANR-10-EQPX- 29-01) overseen by the French National Research Agency (ANR) as part of the Investissements d’Avenir program.
References
- Aarseth, S., Lin, D., & Papaloizou, J. 1988, ApJ, 324, 288 [NASA ADS] [CrossRef] [Google Scholar]
- Aguilar, L., & Merritt, D. 1990, ApJ, 354, 73 [NASA ADS] [CrossRef] [Google Scholar]
- Barnes, E. I., Lanzel, P. A., & Williams, L. L. R. 2009, ApJ, 704, 372 [NASA ADS] [CrossRef] [Google Scholar]
- Benhaiem, D., & Sylos Labini, F. 2015, MNRAS, 448, 2634 [NASA ADS] [CrossRef] [Google Scholar]
- Benhaiem, D., Joyce, M., Sylos Labini, F., & Worrakitpoonpon, T. 2016, A&A, 585, A139 [NASA ADS] [CrossRef] [EDP Sciences] [Google Scholar]
- Binney, J., & Tremaine, S. 1994, Galactic Dynamics (Princeton University Press) [Google Scholar]
- Boily, C. M., & Athanassoula, E. 2006, MNRAS, 369, 608 [NASA ADS] [CrossRef] [Google Scholar]
- Boily, C., Athanassoula, E., & Kroupa, P. 2002, MNRAS, 332, 971 [NASA ADS] [CrossRef] [Google Scholar]
- David, M., & Theuns, T. 1989, MNRAS, 240, 957 [NASA ADS] [Google Scholar]
- Henon, M. 1964, Ann. Astrophys., 27, 83 [Google Scholar]
- Joyce, M., Marcos, B., & Sylos Labini, F. 2009, MNRAS, 397, 775 [NASA ADS] [CrossRef] [Google Scholar]
- McGlynn, T. 1984, ApJ, 281, 13 [Google Scholar]
- Merrall, T., & Henriksen, R. 2003, ApJ, 595, 43 [NASA ADS] [CrossRef] [Google Scholar]
- Merritt, D., & Aguilar, L. A. 1985, MNRAS, 217, 787 [NASA ADS] [CrossRef] [Google Scholar]
- Onions, J., Knebe, A., Pearce, F. R., et al. 2012, MNRAS, 423, 1200 [NASA ADS] [CrossRef] [Google Scholar]
- Peebles, P. J. E. 1969, ApJ, 155, 393 [NASA ADS] [CrossRef] [Google Scholar]
- Roy, F., & Perez, J. 2004, MNRAS, 348, 62 [NASA ADS] [CrossRef] [Google Scholar]
- Springel, V., Yoshida, N., & White, S. D. M. 2001, New Astron., 6, 79, (also available on Springel et al. 2001) [Google Scholar]
- Springel, V., White, S. D. M., Jenkins, A., et al. 2005, Nature, 435, 629 [NASA ADS] [CrossRef] [PubMed] [Google Scholar]
- Sylos Labini, F. 2012, MNRAS, 423, 1610 [NASA ADS] [CrossRef] [Google Scholar]
- Sylos Labini, F. 2013, MNRAS, 429, 679 [NASA ADS] [CrossRef] [Google Scholar]
- Sylos Labini, F., Benhaiem, D., & Joyce, M. 2015, MNRAS, 449, 4458 [NASA ADS] [CrossRef] [Google Scholar]
- Theis, C., & Spurzem, R. 1999, A&A, 341, 361 [NASA ADS] [Google Scholar]
- Theuns, T., & David, M. 1990, Astrophys. Space Sci., 170, 267 [NASA ADS] [CrossRef] [Google Scholar]
- van Albada, T. 1982, MNRAS, 201, 939 [NASA ADS] [CrossRef] [Google Scholar]
- Villumsen, J. 1984, ApJ, 284, 75 [NASA ADS] [CrossRef] [Google Scholar]
- Worrakitpoonpon, T. 2015, MNRAS, 466, 1335 [NASA ADS] [CrossRef] [Google Scholar]
All Tables
All Figures
|
Fig. 1 Simulation C1. Upper panel: total energy. Bottom panel: virial ratio of all particles (solid line) and of bound ones (dashed line). |
| In the text | |
|
Fig. 2 Simulation C1. Upper panel: behaviour of the shape parameters ι,φ,τ for the more 60% highly bound particles of the largest virialized structure. Bottom panel: behaviour of the gravitational radius. |
| In the text | |
|
Fig. 3 Simulation C1. Left panel: density profile (the solid line is a power law with an exponent −4). Right panel: radial velocity dispersion profile (the solid line is a power law with an exponent −1). |
| In the text | |
|
Fig. 4 Ratio between the minor and major eigenvalue of the weakly bound particles (WBP) at time >τc and of the initial cloud (IC) in the different runs. |
| In the text | |
|
Fig. 5 Probability density function of the angles Ψ and Φ (see text for details). |
| In the text | |
|
Fig. 6 Evolution at different times (see labels –; times are given in units of τc) of two satellites of a typical simulation (C1; distances are given in units of the initial cloud radius R0). The two satellites considered here are on opposite sides of the largest virialized object and have different return times. |
| In the text | |
|
Fig. 7 Energy distribution of all particles (black) and of the particles belonging to the two satellites of the simulation C1 (the colour code of the satellites is the same as in Fig. 6) at t = 4τc of a typical simulation. (The energy is given in units of e0 = GNm2/R0.) |
| In the text | |
|
Fig. 8 Upper panel: evolution of the absolute value of the virial ratio for two different satellites of simulation C1. Middle panel: velocity of their centre of mass in the rest of frame the main structure. Bottom panel: behaviour of ι100, i.e. the flatness parameter for all bound particles. |
| In the text | |
|
Fig. 9 Fraction of ejected particles as a function of time for the simulation C1. The first secondary ejection, due to arrival of the first satellite to the main object, is clearly visible at t = 13τc. |
| In the text | |
|
Fig. 10 Probability of sin(θ) where θ is the angle between the plane identified by the two largest semi-axes of the main structure and the line passing through the main structure centre and the satellite centre. |
| In the text | |
|
Fig. 11 Standard spin parameter (see text) of the main virialized object in all the different runs. |
| In the text | |
Current usage metrics show cumulative count of Article Views (full-text article views including HTML views, PDF and ePub downloads, according to the available data) and Abstracts Views on Vision4Press platform.
Data correspond to usage on the plateform after 2015. The current usage metrics is available 48-96 hours after online publication and is updated daily on week days.
Initial download of the metrics may take a while.