Fig. 8
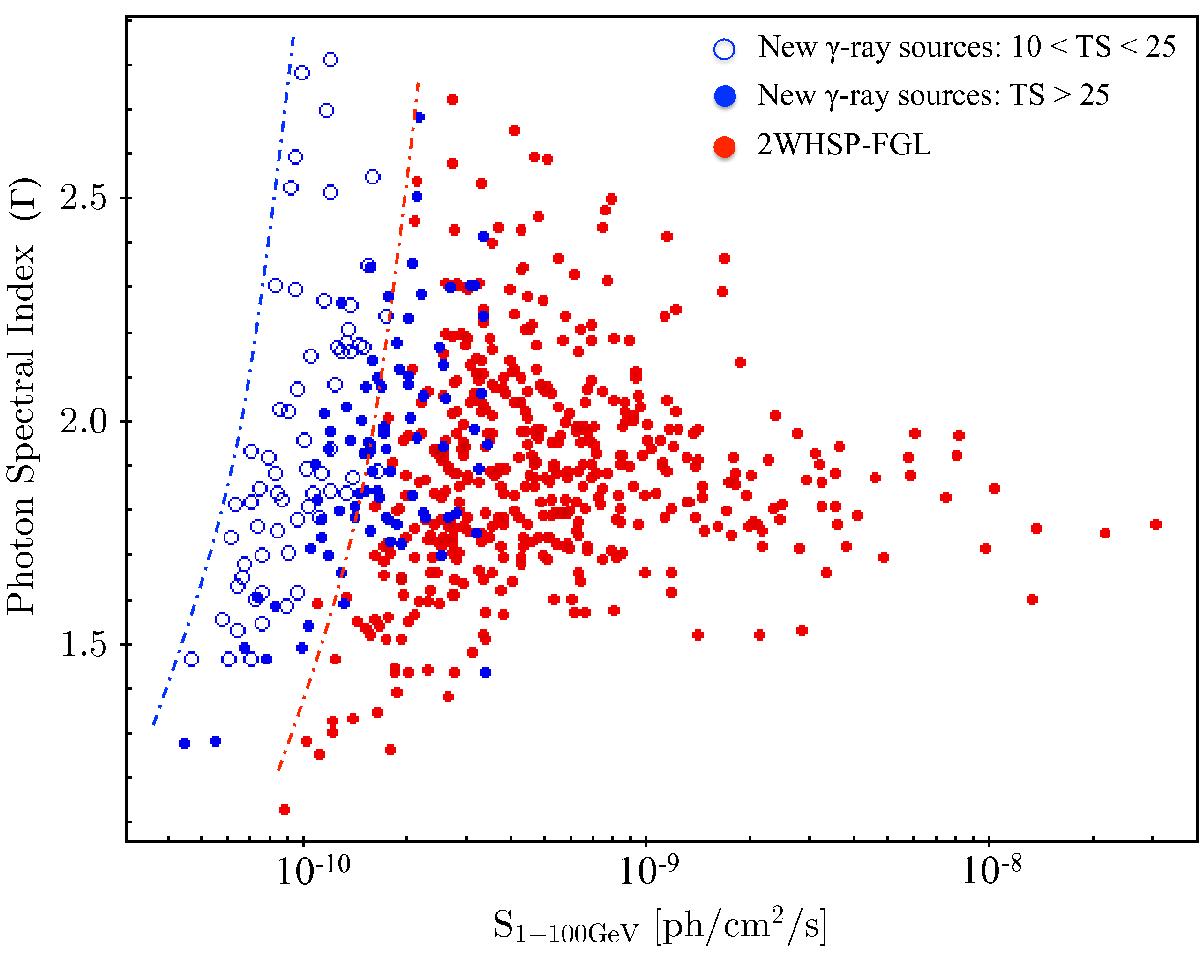
Photon spectral index Γ plotted against total flux S1−100 GeV for the 439 2WHSP-FGL sources (in red), the 85 new detections with TS > 25 (filled-in blue), and for the 65 lower-significance detections with TS between 10 and 25 (blue outlines). The dashed lines represent the flux limit achieved by 3FGL-4 yr (red) and by our direct search based on 7.2 yr of data (blue) down to TS = 10.
Current usage metrics show cumulative count of Article Views (full-text article views including HTML views, PDF and ePub downloads, according to the available data) and Abstracts Views on Vision4Press platform.
Data correspond to usage on the plateform after 2015. The current usage metrics is available 48-96 hours after online publication and is updated daily on week days.
Initial download of the metrics may take a while.