Fig. 22
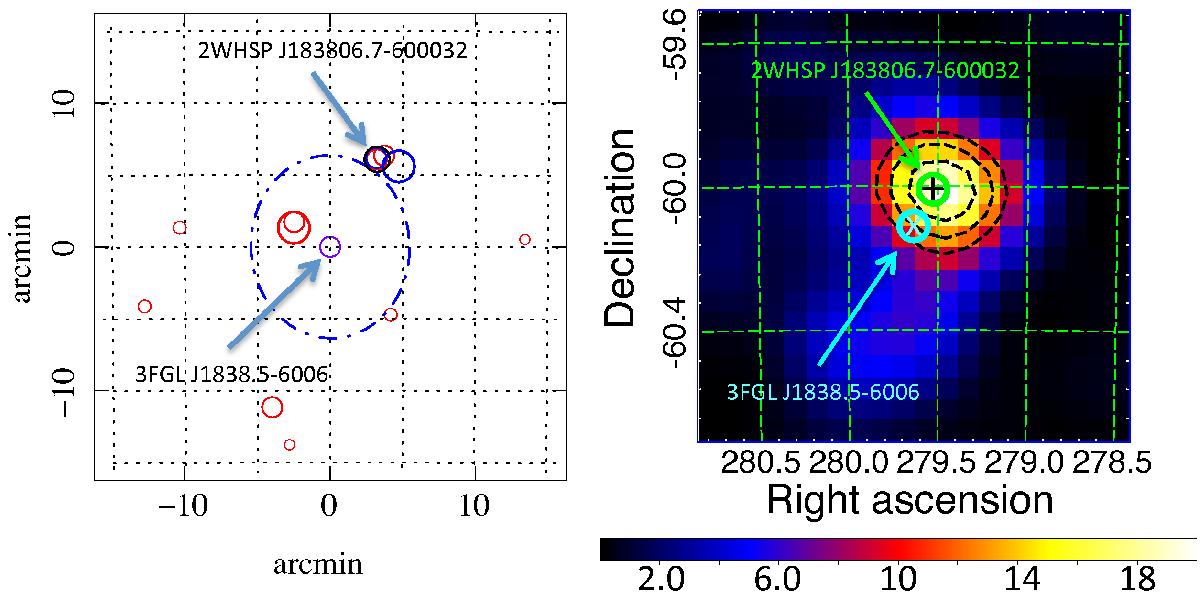
Left panel: error-circle (dash-dotted) associated with the 3FGL source. Right panel: high-energy 3−500 GeV TS map, integrating over 7 yr of Fermi-LAT observations. The contour black dashed lines are TS surfaces representing 68%, 95% and 99% containment region for the γ-ray signature (from inner to outer lines). The 2WHSP J183806.7-600032 (thick green circle centered on +). The 3FGL J1838.5-6006 position is shows in cyan (centered on ×), ≈6.9′ away from the high-energy TS peak.
Current usage metrics show cumulative count of Article Views (full-text article views including HTML views, PDF and ePub downloads, according to the available data) and Abstracts Views on Vision4Press platform.
Data correspond to usage on the plateform after 2015. The current usage metrics is available 48-96 hours after online publication and is updated daily on week days.
Initial download of the metrics may take a while.