Fig. 7
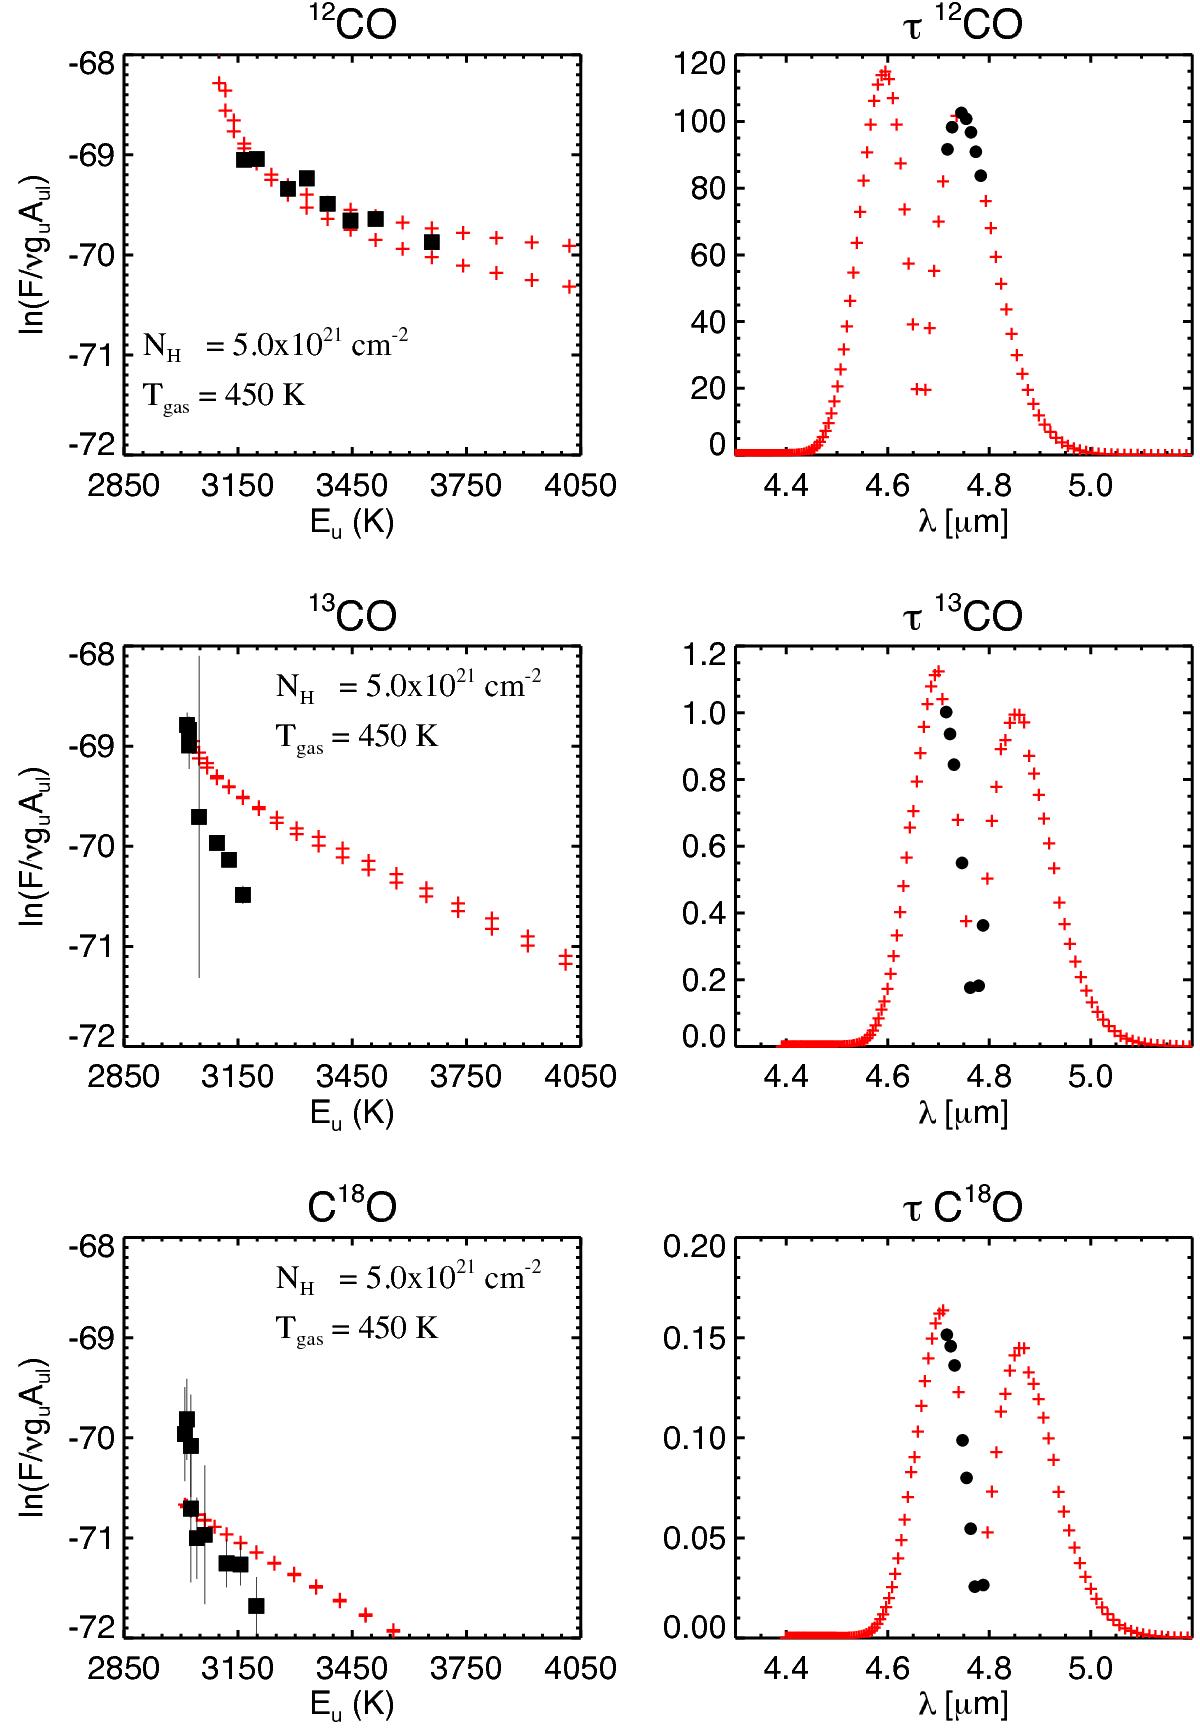
Rotational diagrams and optical depths of the slab model (NH = 5 × 1021 cm-2, Tgas = 450 K) with the lowest ![]() combining all the 12CO, 13CO, and C18O data (cross in Fig. 6). In the left panels observations are shown in black and models in red. In the right panels the optical depths of the observed transitions are shown in black, other transitions are plotted in red. A single-temperature and single-density slab does not correctly describe the rotational diagrams of the three CO isotopologs simultaneously. Error bars on the rotational diagram are 1σ.
combining all the 12CO, 13CO, and C18O data (cross in Fig. 6). In the left panels observations are shown in black and models in red. In the right panels the optical depths of the observed transitions are shown in black, other transitions are plotted in red. A single-temperature and single-density slab does not correctly describe the rotational diagrams of the three CO isotopologs simultaneously. Error bars on the rotational diagram are 1σ.
Current usage metrics show cumulative count of Article Views (full-text article views including HTML views, PDF and ePub downloads, according to the available data) and Abstracts Views on Vision4Press platform.
Data correspond to usage on the plateform after 2015. The current usage metrics is available 48-96 hours after online publication and is updated daily on week days.
Initial download of the metrics may take a while.