Fig. 6
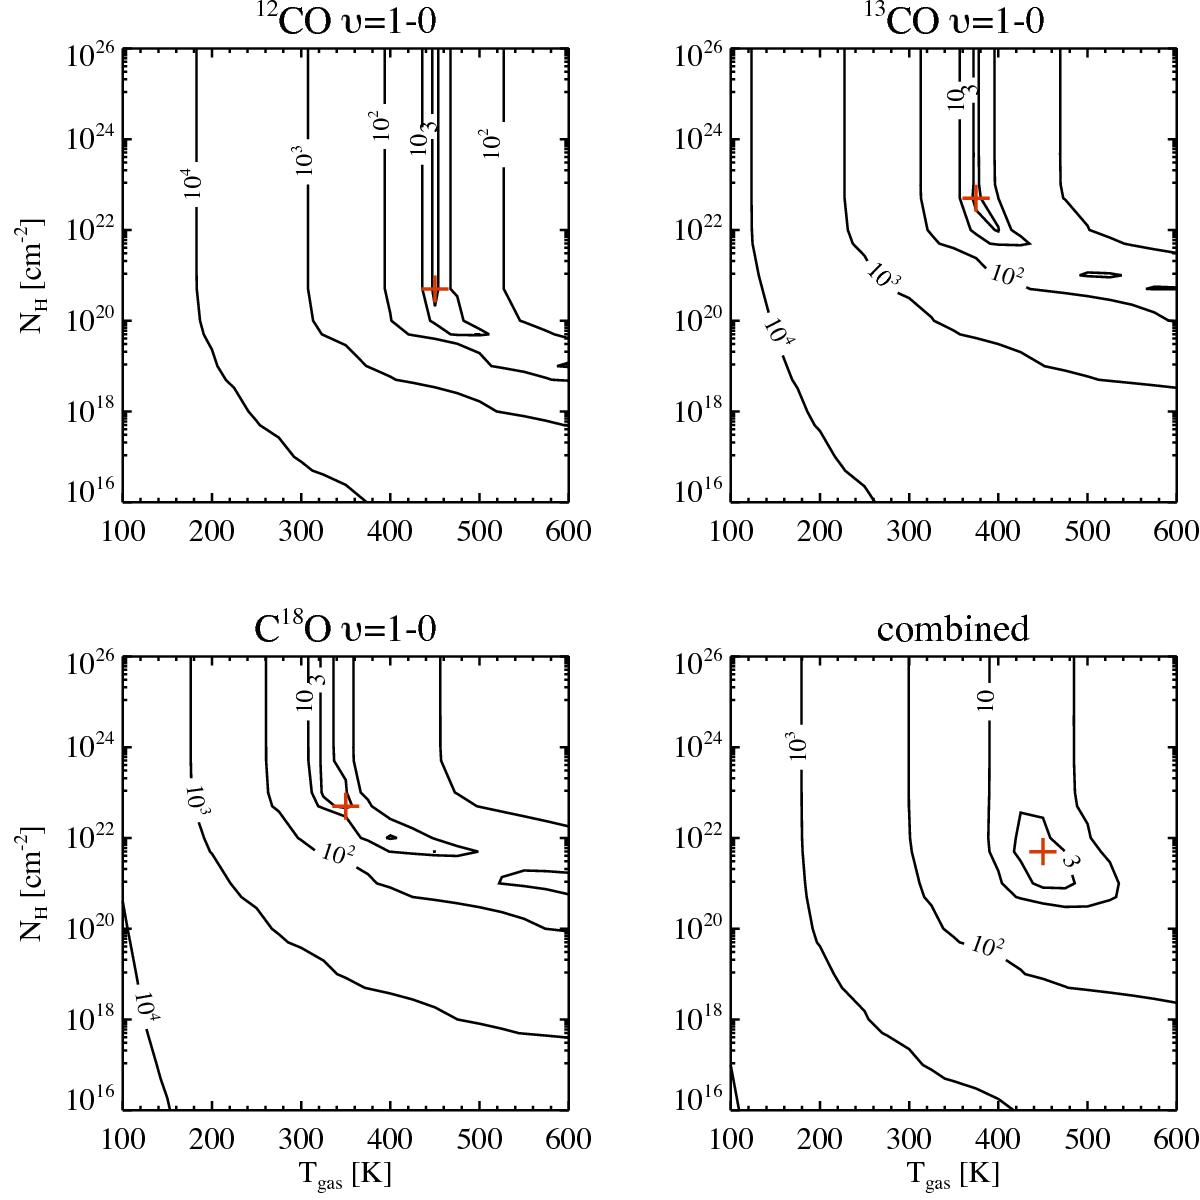
![]() contour plot of the modeled rotational diagrams for 12CO, 13CO, and C18O using a single temperature and surface density slab model. The combined
contour plot of the modeled rotational diagrams for 12CO, 13CO, and C18O using a single temperature and surface density slab model. The combined ![]() contour plot is obtained by simultaneously using all the data of the three isotopologs. The cross indicates the location of the
contour plot is obtained by simultaneously using all the data of the three isotopologs. The cross indicates the location of the ![]() minimum in each panel. The numbers inside the contour indicate n-times the value of the minimum
minimum in each panel. The numbers inside the contour indicate n-times the value of the minimum ![]() .
.
Current usage metrics show cumulative count of Article Views (full-text article views including HTML views, PDF and ePub downloads, according to the available data) and Abstracts Views on Vision4Press platform.
Data correspond to usage on the plateform after 2015. The current usage metrics is available 48-96 hours after online publication and is updated daily on week days.
Initial download of the metrics may take a while.