Fig. 5
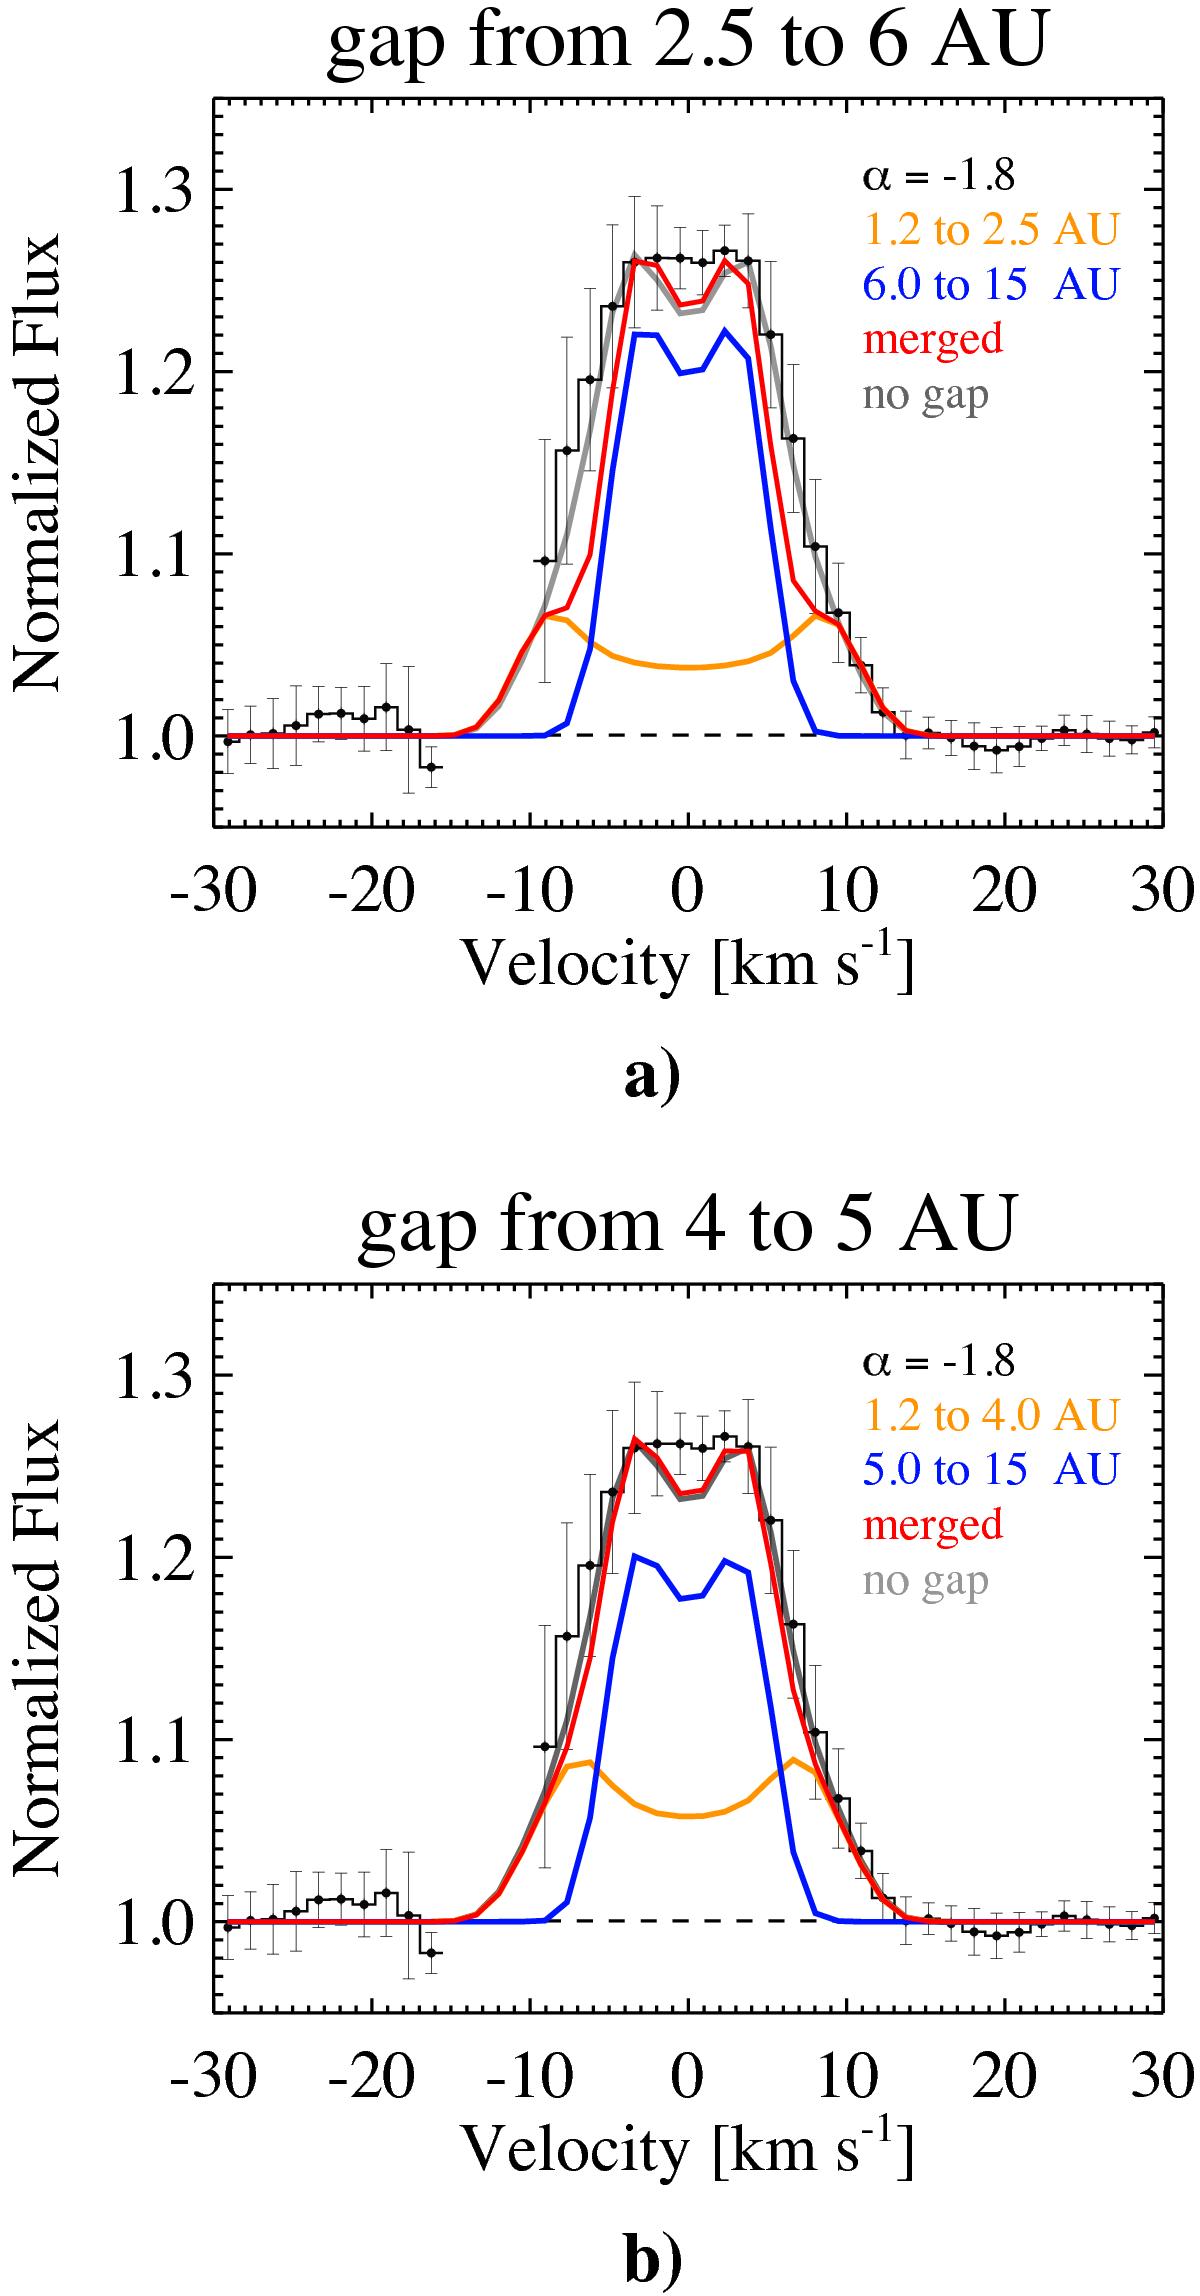
Line-profiles predicted for models with a gap in the intensity distribution: a) line-profiles expected for a intensity distribution with a gap devoid of gas from 2.5 AU to 6 AU, in orange the contribution from 1.2 to 2.5 AU, in blue the contribution from 6 to 15 AU, and in red the total line-profile; b) similar plot but for a gap devoid of gas of width 1 AU extending from 5 to 6 AU. Error bars on the spectrum are 1σ.
Current usage metrics show cumulative count of Article Views (full-text article views including HTML views, PDF and ePub downloads, according to the available data) and Abstracts Views on Vision4Press platform.
Data correspond to usage on the plateform after 2015. The current usage metrics is available 48-96 hours after online publication and is updated daily on week days.
Initial download of the metrics may take a while.