Free Access
Fig. 4
![]() contour plot for the grid of flat disk Keplerian models with a power-law intensity. The black cross displays the model with the lowest
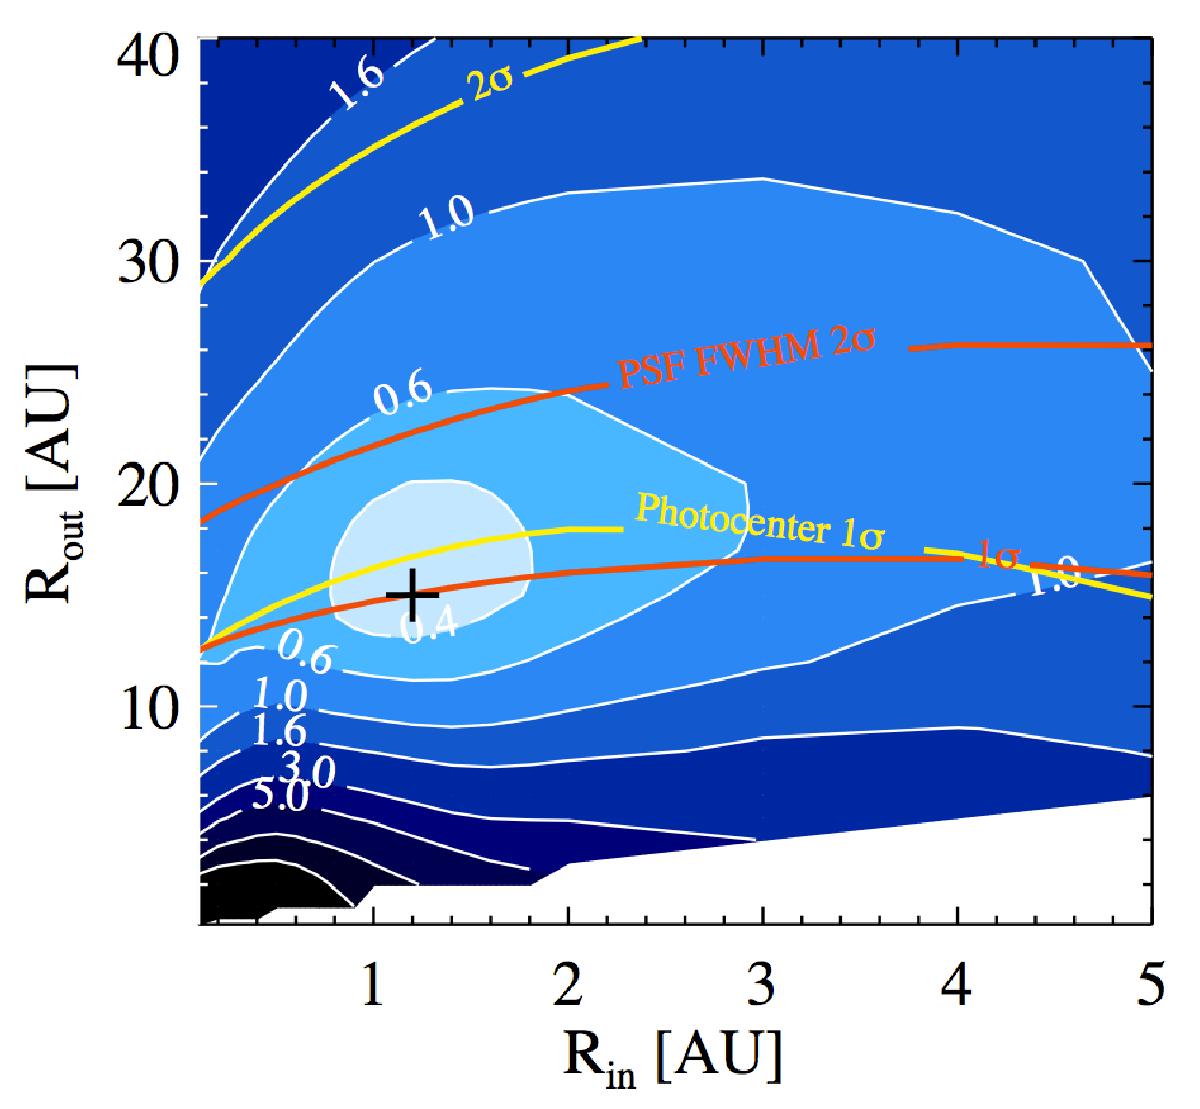
contour plot for the grid of flat disk Keplerian models with a power-law intensity. The black cross displays the model with the lowest ![]() (0.35). The yellow and red curves show, for each Rin, the value of Rout that would generate a 1σ spectro-astrometric signal or a 1σPSF-FHWM broadening, respectively.
(0.35). The yellow and red curves show, for each Rin, the value of Rout that would generate a 1σ spectro-astrometric signal or a 1σPSF-FHWM broadening, respectively.
Current usage metrics show cumulative count of Article Views (full-text article views including HTML views, PDF and ePub downloads, according to the available data) and Abstracts Views on Vision4Press platform.
Data correspond to usage on the plateform after 2015. The current usage metrics is available 48-96 hours after online publication and is updated daily on week days.
Initial download of the metrics may take a while.