Fig. C.6
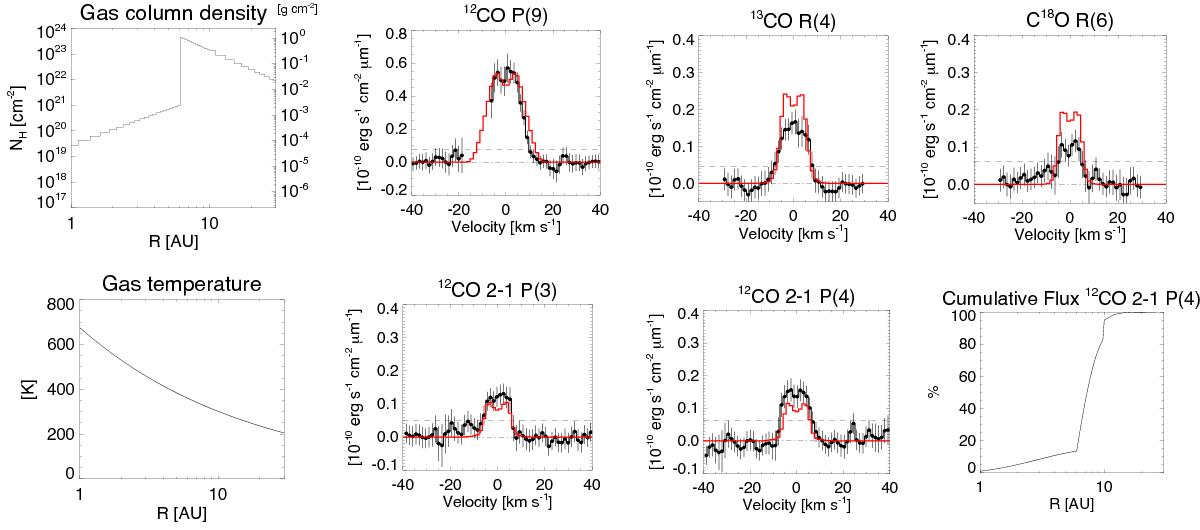
Surface density and temperature profile, and predicted υ = 1 → 012CO P(9), 13CO R(4), C18O R(6), and υ = 2 → 112CO P(3) and 12CO P(4) line-profiles for a model with NH at R = 6 AU three times larger than the best-fit grid model (NH (R = 6 AU) = 3 × 1023 cm-2). The higher NH enables to describe the υ = 2 → 112CO P(3) and 12CO P(4) line-profiles while keeping a good fit to the υ = 1 → 0 lines. The model has the same temperature structure and same surface density at R< 6 as the best-fit grid model (thus δgas = 3.3 × 10⁻³). The cumulative flux plot shows that the υ = 2 → 1 lines are dominated by the contribution at 6 <R< 10 AU. Errors in the plot are 3σ, and the dashed horizontal line is the 5σ limit.
Current usage metrics show cumulative count of Article Views (full-text article views including HTML views, PDF and ePub downloads, according to the available data) and Abstracts Views on Vision4Press platform.
Data correspond to usage on the plateform after 2015. The current usage metrics is available 48-96 hours after online publication and is updated daily on week days.
Initial download of the metrics may take a while.