Fig. 2
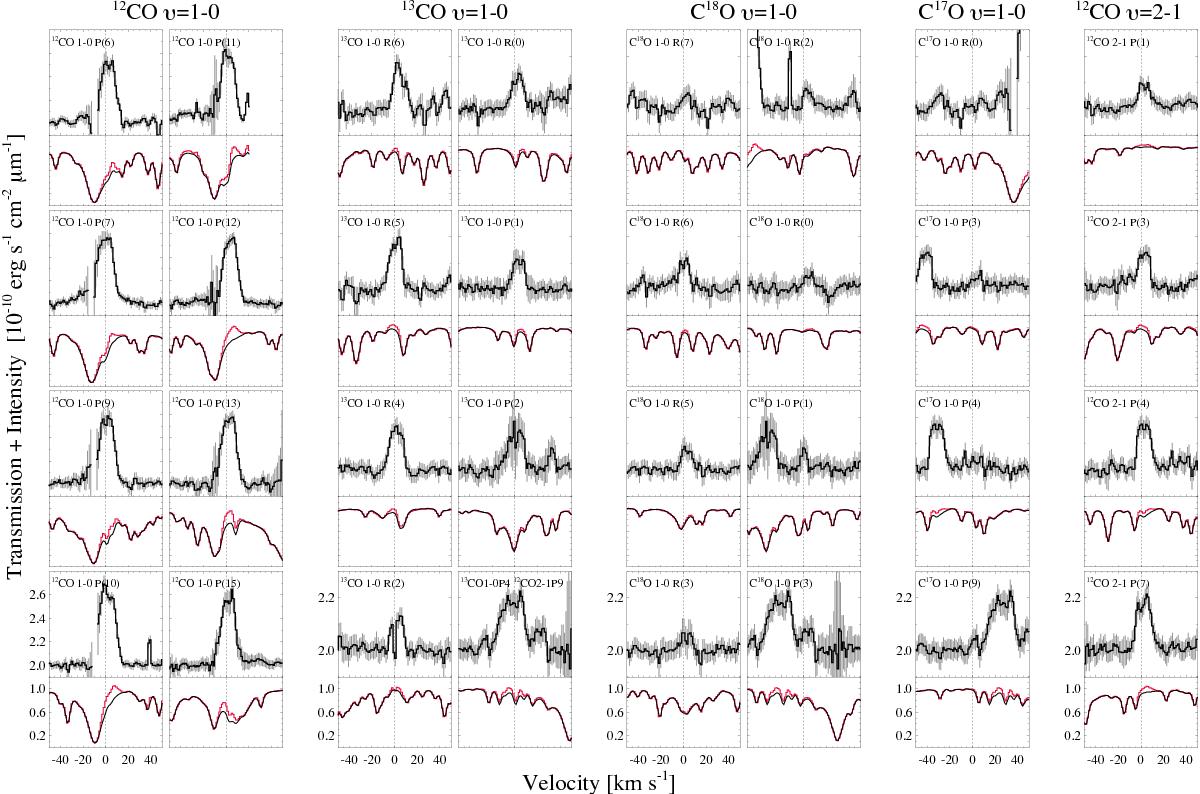
Examples of the υ = 1 → 012CO, 13CO, C18O, C17O and υ = 2 → 112CO lines observed. The lower panels display the normalized spectrum of the target (in red) and the spectrum of the telluric standard (in black). The spectra are presented corrected by the radial velocity of HD 139614 and the barycentric velocity. The references for v = 0 km s-1 are the theoretical wavelengths of each of the transitions. Note that the flux scale is larger for the υ = 1 → 012CO lines. Error bars are 3σ. Several υ = 3 → 212CO lines were covered in the spectra but none were detected. See Table A.1 for a summary of the centers, fluxes, flux upper limits and FWHM of the lines.
Current usage metrics show cumulative count of Article Views (full-text article views including HTML views, PDF and ePub downloads, according to the available data) and Abstracts Views on Vision4Press platform.
Data correspond to usage on the plateform after 2015. The current usage metrics is available 48-96 hours after online publication and is updated daily on week days.
Initial download of the metrics may take a while.