Fig. B.1
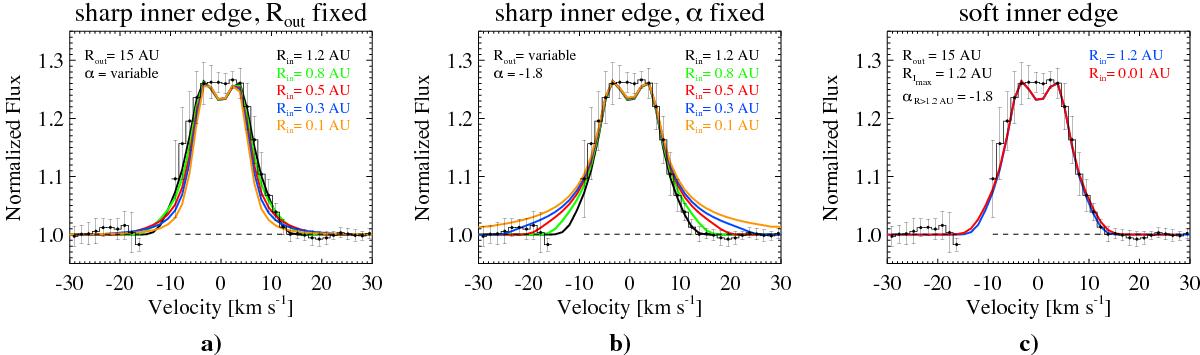
Line-profiles predicted for models around the best solution of the power-law intensity model: a) effect of varying the inner radius with the outer radius fixed; b) effect of varying the inner radius keeping α fixed. In the models, α or Rout are adjusted such that I(Rout) = 0.01 × I(Rin); c) line-profile for an intensity distribution with a sharp increase at 1.2 AU (in blue) and the line-profile of an intensity distribution that grows as a power-law from 0.01 AU to 1.2 AU (in red). In both models the intensity decreases with α = −1.8 at R> 1.2 AU. Error bars on the composite spectrum are 1σ.
Current usage metrics show cumulative count of Article Views (full-text article views including HTML views, PDF and ePub downloads, according to the available data) and Abstracts Views on Vision4Press platform.
Data correspond to usage on the plateform after 2015. The current usage metrics is available 48-96 hours after online publication and is updated daily on week days.
Initial download of the metrics may take a while.