Fig. 17
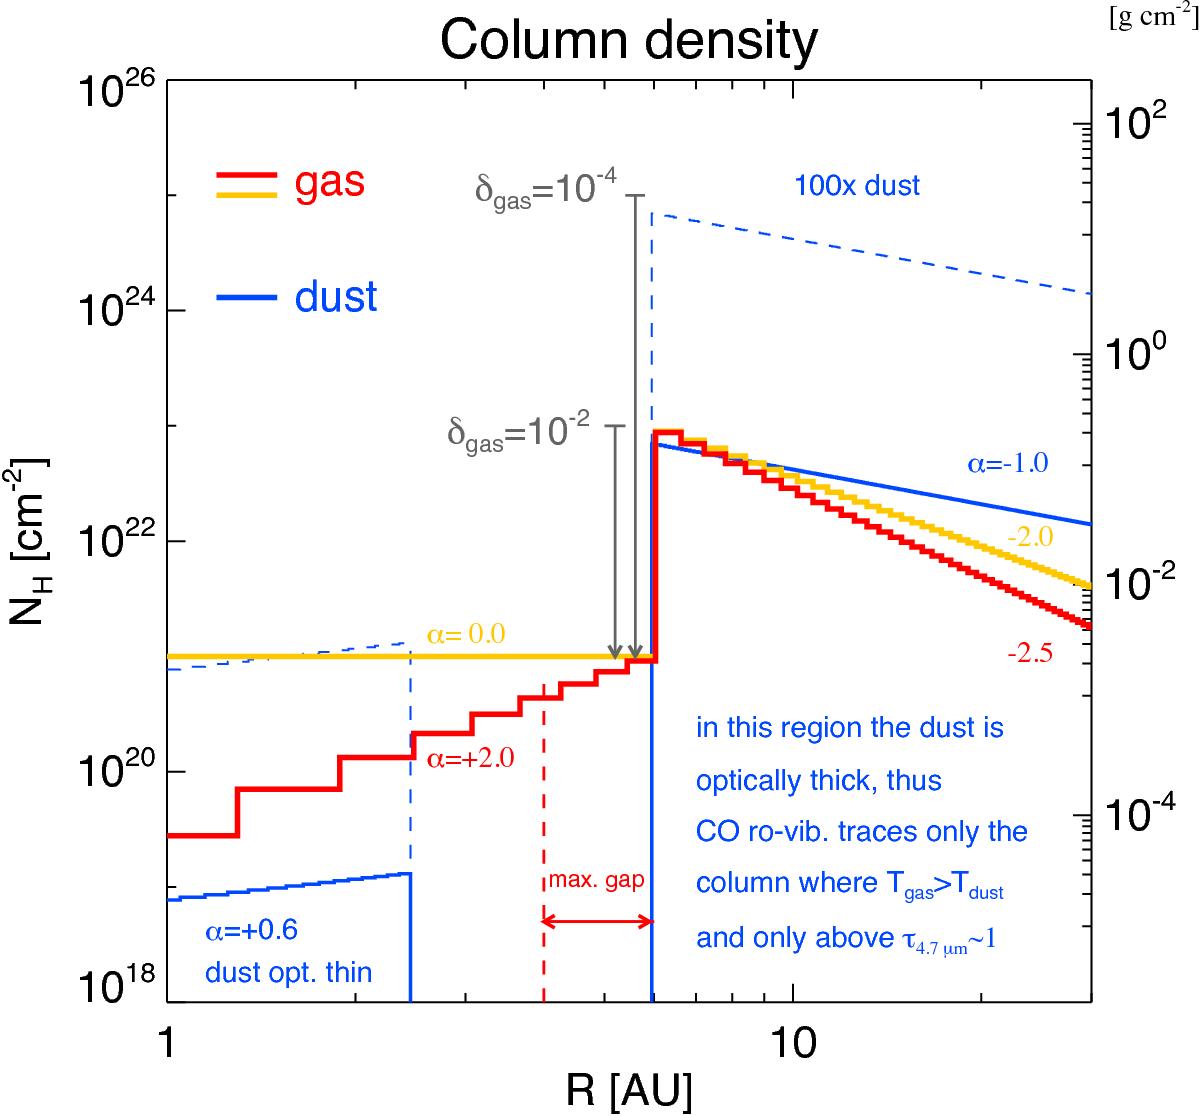
Gas and dust surface density. In blue we show the dust surface density derived from modeling the SED + near and mid-IR observations, taken from Matter et al. (2016). In red we plot the gas surface density of the best-fit model of the whole grid. In orange we show the gas surface density of the best-fit grid model restricted to only models with αNH inner ≤ + 1.0. Note that the value of δgas depends on the gas-to-dust ratio assumed for the outer disk. This plot assumes a distance of 140 pc for HD 139614. The new Gaia distance of 131 ± 5 pc implies that the location of the gas and dust density drop is 0.4 AU closer in. However, this difference is within the uncertainties of the modeling of the data.
Current usage metrics show cumulative count of Article Views (full-text article views including HTML views, PDF and ePub downloads, according to the available data) and Abstracts Views on Vision4Press platform.
Data correspond to usage on the plateform after 2015. The current usage metrics is available 48-96 hours after online publication and is updated daily on week days.
Initial download of the metrics may take a while.