Fig. 15
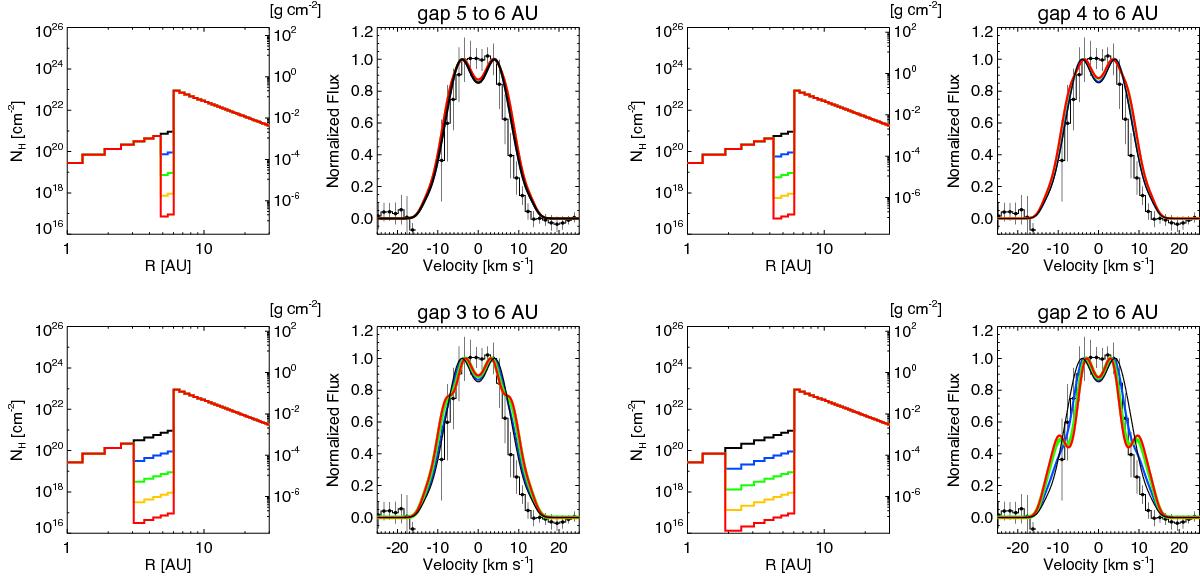
12CO P(9) line-profiles predicted for different gap sizes and diverse column densities inside the gap, for the best-fit grid model (see Fig. 13), compared with composite 12CO line-profile. Observed and modeled line-profiles are normalized such that the continuum is at zero and the line peak at 1. The color code in the surface density density panel corresponds to the color in the line-profile plot. The solution without gap is displayed in black. The temperature profile is kept constant in all the models. Error bars are 1σ.
Current usage metrics show cumulative count of Article Views (full-text article views including HTML views, PDF and ePub downloads, according to the available data) and Abstracts Views on Vision4Press platform.
Data correspond to usage on the plateform after 2015. The current usage metrics is available 48-96 hours after online publication and is updated daily on week days.
Initial download of the metrics may take a while.