Fig. 13
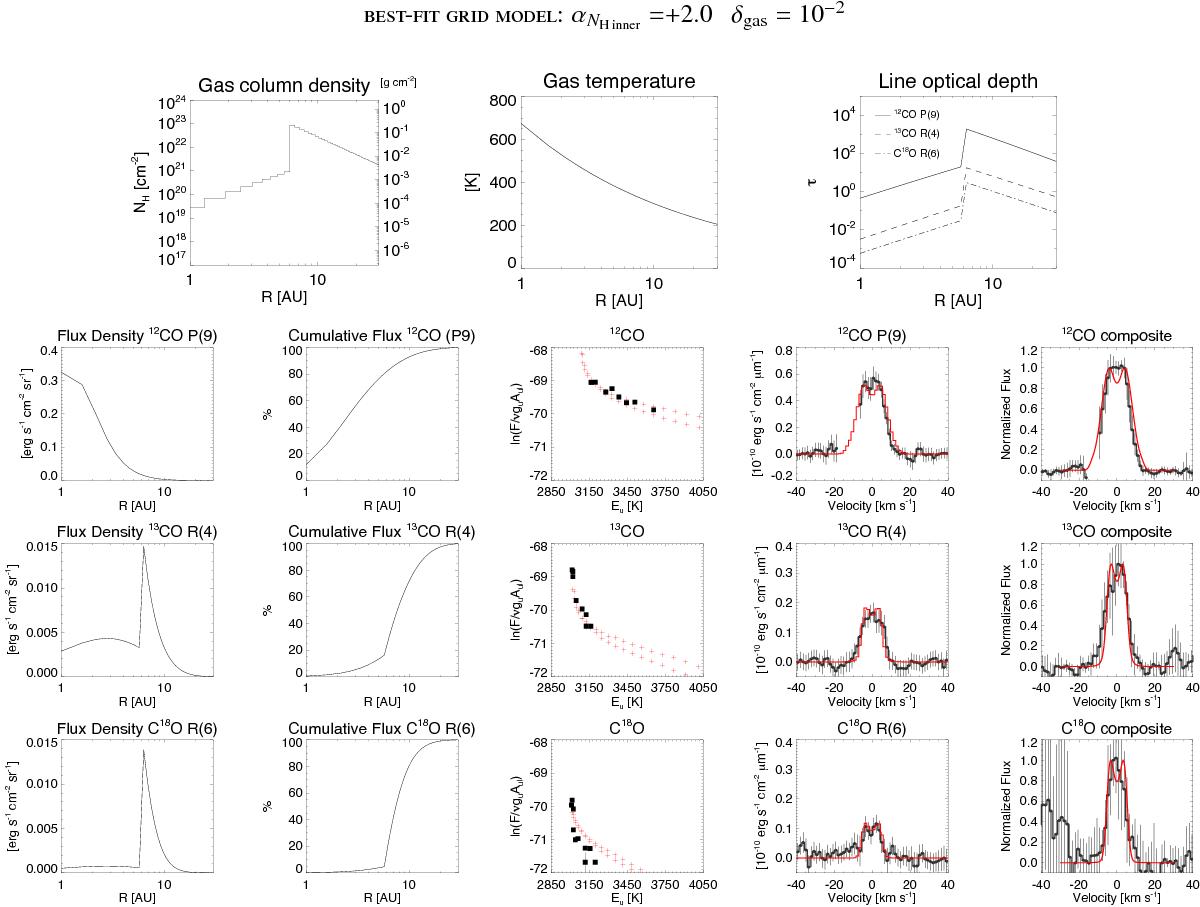
Gas column density, temperature, CO optical depth, flux density, cumulative line flux, rotational diagrams, and line-profiles of the 12CO P(9), 13CO R(4), and C18O R(6) emissions of the best-fit grid model. The model is shown in red, and the observations in black. Observed line-profiles are displayed in flux units after continuum subtraction with 3σ error bars. The two branches seen in the rotational diagram correspond to the R and P branches of CO ro-vibrational emission. The rightmost panels compare the normalized theoretical line-profiles with the observed composite line-profile of each CO isotopolog with a 1σ error bar.
Current usage metrics show cumulative count of Article Views (full-text article views including HTML views, PDF and ePub downloads, according to the available data) and Abstracts Views on Vision4Press platform.
Data correspond to usage on the plateform after 2015. The current usage metrics is available 48-96 hours after online publication and is updated daily on week days.
Initial download of the metrics may take a while.