Fig. 12
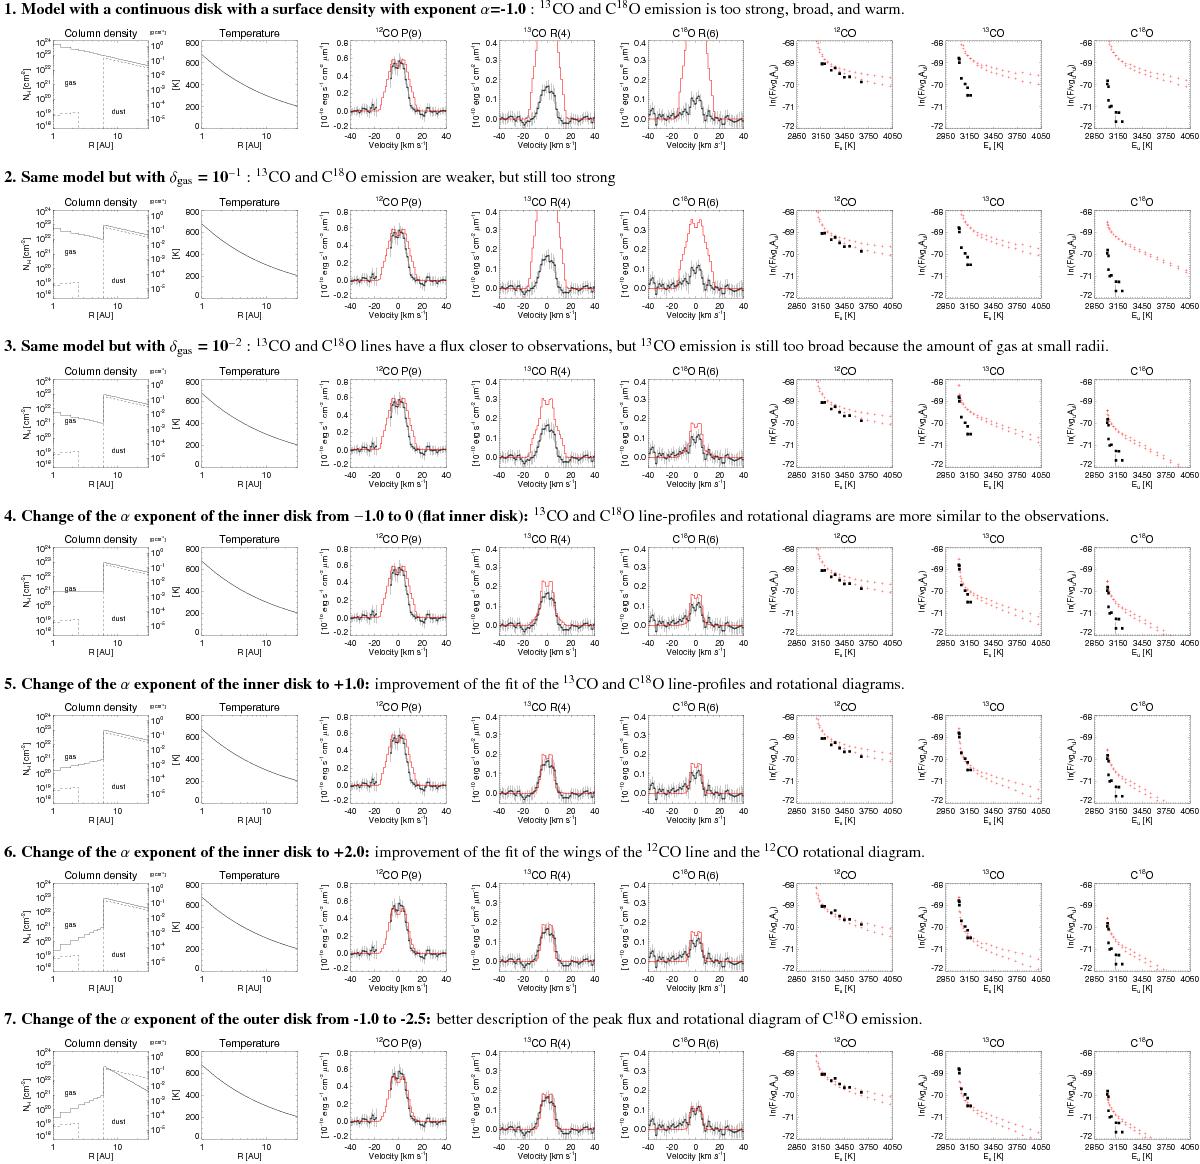
Example of a progression of disk models taken from the grid to illustrate the effect of the change of parameters in the line-profiles and rotational diagrams. The observed data are plotted in black, and the model predictions in red. Error bars on the line-profiles are 3σ. The dashed line is the dust surface density from Matter et al. (2016). The model starts with a continuous gas disk that follows the same power-law as the dust in the outer disk, and it is refined until the best description of the CO ro-vibrational observations is reached. The two branches seen in the rotational diagram correspond to the R and P branches of CO ro-vibrational emission.
Current usage metrics show cumulative count of Article Views (full-text article views including HTML views, PDF and ePub downloads, according to the available data) and Abstracts Views on Vision4Press platform.
Data correspond to usage on the plateform after 2015. The current usage metrics is available 48-96 hours after online publication and is updated daily on week days.
Initial download of the metrics may take a while.