Fig. 4
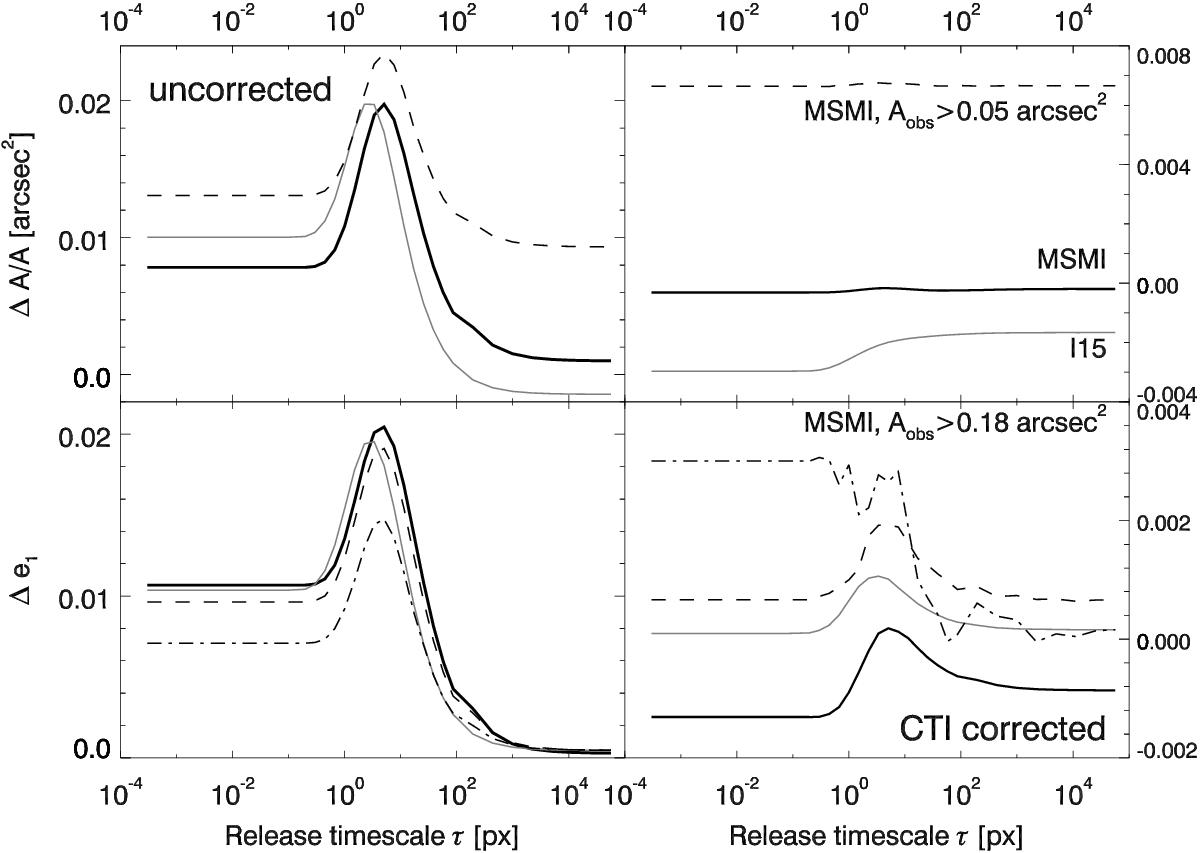
CTI-induced relative size bias ΔA/A (upper panels) and ellipticity bias Δe1 (lower panels) caused by a single trap species of time scale τ (in units of pixels clocked charge has travelled) and unit density. Measurements before (left panels) and after (right panels) CTI correction are shown for the I15 faint galaxy sample for four shape measurement choices: the I15 default (iterative centroiding and adaptive weight function width ω and ![]() ; grey solid lines; also cf. Fig. 2 of I15); the most shape-measurement independent (MSMI) choice of SExtractor centroids and fixed
; grey solid lines; also cf. Fig. 2 of I15); the most shape-measurement independent (MSMI) choice of SExtractor centroids and fixed ![]() (black solid lines); MSMI with a size cut
(black solid lines); MSMI with a size cut ![]() (dashed lines) and MSMI with a size cut
(dashed lines) and MSMI with a size cut ![]() (dot-dashed lines, off scale for ΔA/A). Uncertainties are smaller than the line widths. The results in this figure correspond to a trap density of 24% of the Euclid end-of-life estimate.
(dot-dashed lines, off scale for ΔA/A). Uncertainties are smaller than the line widths. The results in this figure correspond to a trap density of 24% of the Euclid end-of-life estimate.
Current usage metrics show cumulative count of Article Views (full-text article views including HTML views, PDF and ePub downloads, according to the available data) and Abstracts Views on Vision4Press platform.
Data correspond to usage on the plateform after 2015. The current usage metrics is available 48-96 hours after online publication and is updated daily on week days.
Initial download of the metrics may take a while.