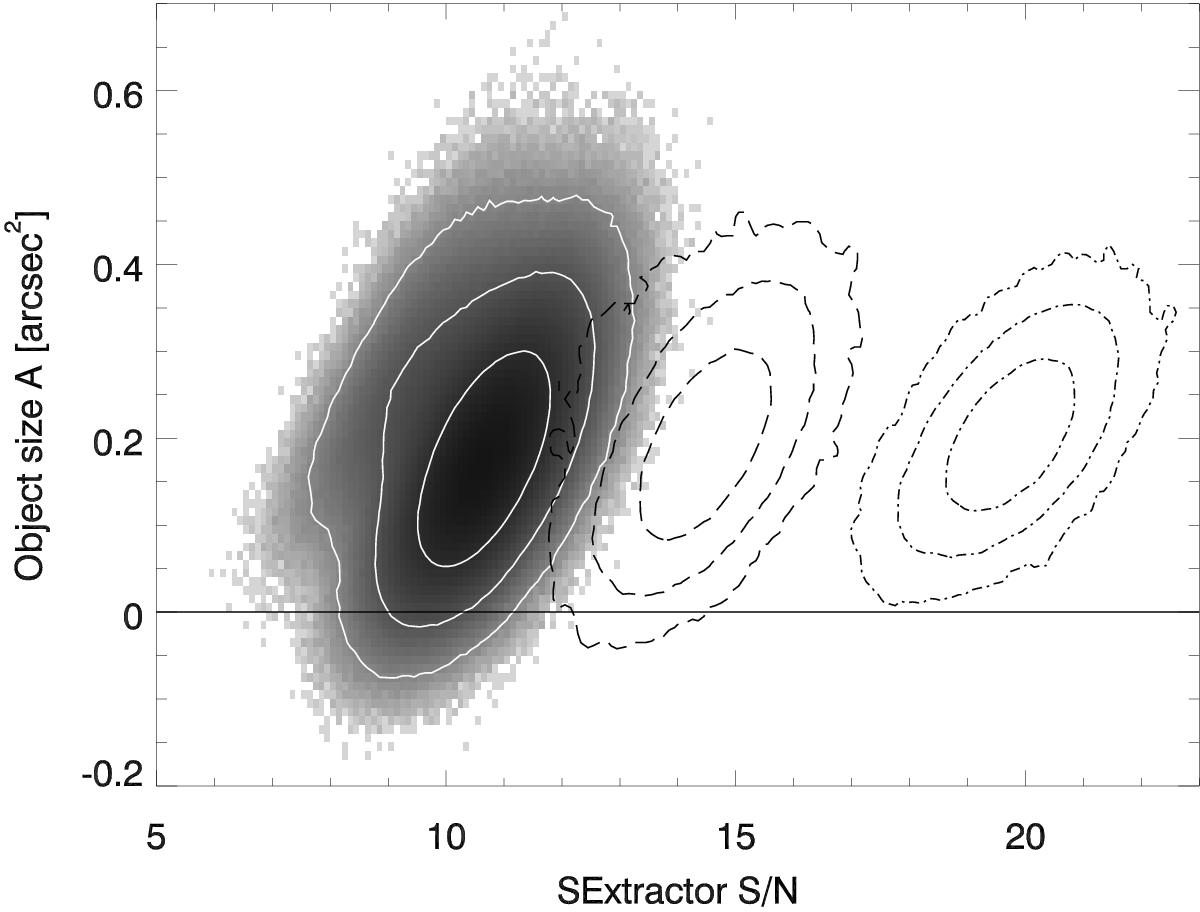
Fig. 1

Histogram of the measured values of Aobs = Q11 + Q22 from simulations of the CTI effect, as a function of the object signal-to-noise ratio. The logarithmic grey scale and white contours (enclosing 68.3%, 95.45%, and 99.73% of samples, respectively) show the 107 exponential disk galaxies analysed in I15. Input simulations containing Poisson distributed sky noise were subjected to CTI and Gaussian read-out noise. Then, the CTI was removed using the correct trap model. Dashed and dot-dashed contours (both smoothed) enclose the same density levels measured from 105 simulations with ~35% (~85%) higher signal-to-noise. In all three cases, the noise causes a non-negligible fraction of the galaxies to be measured with Aobs< 0.
Current usage metrics show cumulative count of Article Views (full-text article views including HTML views, PDF and ePub downloads, according to the available data) and Abstracts Views on Vision4Press platform.
Data correspond to usage on the plateform after 2015. The current usage metrics is available 48-96 hours after online publication and is updated daily on week days.
Initial download of the metrics may take a while.


