Fig. 4
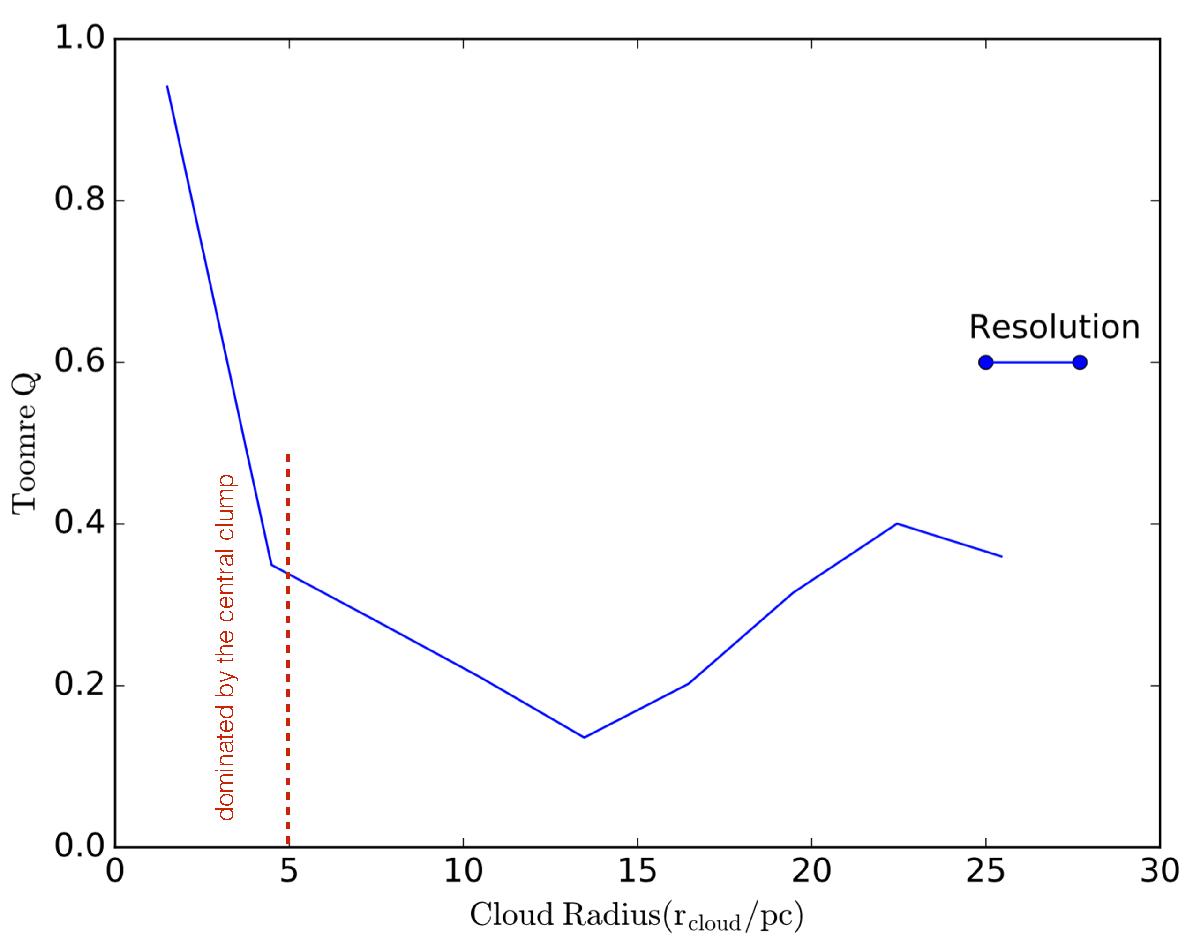
Toomre Q parameter as a function of cloud radius (rcloud). The Toomre Q is defined as Q = σvκ/πGΣ where σv = 1km s-1, Σ is the ring-averaged column density and κ is the epicyclic frequency. The resolution of the plot is 2.7 pc (limited by the size of the rings). It is indicated as the blue horizontal bar. The central 5 pc is dominated by the central clump. This is indicated by the vertical red dashed line.
Current usage metrics show cumulative count of Article Views (full-text article views including HTML views, PDF and ePub downloads, according to the available data) and Abstracts Views on Vision4Press platform.
Data correspond to usage on the plateform after 2015. The current usage metrics is available 48-96 hours after online publication and is updated daily on week days.
Initial download of the metrics may take a while.