Fig. 3
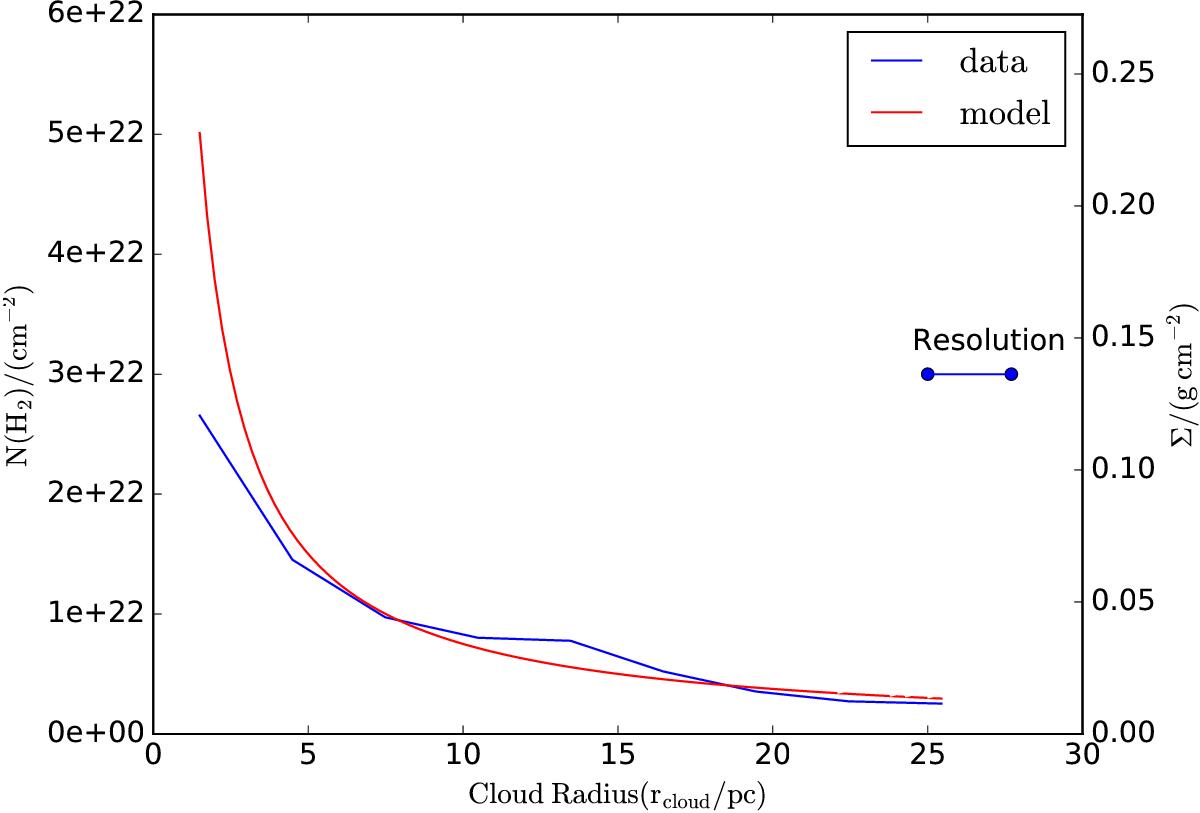
Column density structure of the Spiral Cloud. The figure presents ring-averaged column density as a function of cloud radius. The blue line stands for the data and the red line stands for the analytical model (Eq. (1)). The telescope resolution is ~2.2pc at a distance of 9.8kpc. The resolution of the plot (2.7 pc, limited by the widths of the rings) is indicated as the blue horizontal bar. See Sect. 3.2 for details.
Current usage metrics show cumulative count of Article Views (full-text article views including HTML views, PDF and ePub downloads, according to the available data) and Abstracts Views on Vision4Press platform.
Data correspond to usage on the plateform after 2015. The current usage metrics is available 48-96 hours after online publication and is updated daily on week days.
Initial download of the metrics may take a while.