Fig. D.1
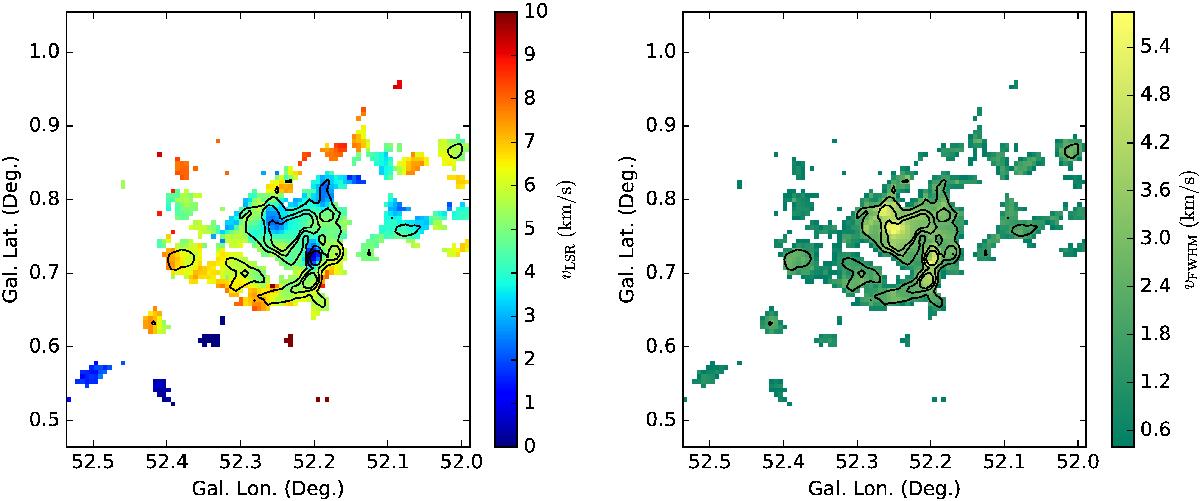
Detailed velocity structure of the spiral cloud. The left panel shows the velocity centroid map, and the right panel shows the velocity FWHM map. Overlaid contours are velocity-integrated 13CO(1–0) emission, and the levels correspond to 5.1, 10.2, 15.3 Kkms-1. In producing these maps, we have excluded vorxels where the emission is below 0.43 K, which corresponds to three times the rms noise level of the data cube.
Current usage metrics show cumulative count of Article Views (full-text article views including HTML views, PDF and ePub downloads, according to the available data) and Abstracts Views on Vision4Press platform.
Data correspond to usage on the plateform after 2015. The current usage metrics is available 48-96 hours after online publication and is updated daily on week days.
Initial download of the metrics may take a while.