Fig. C.2
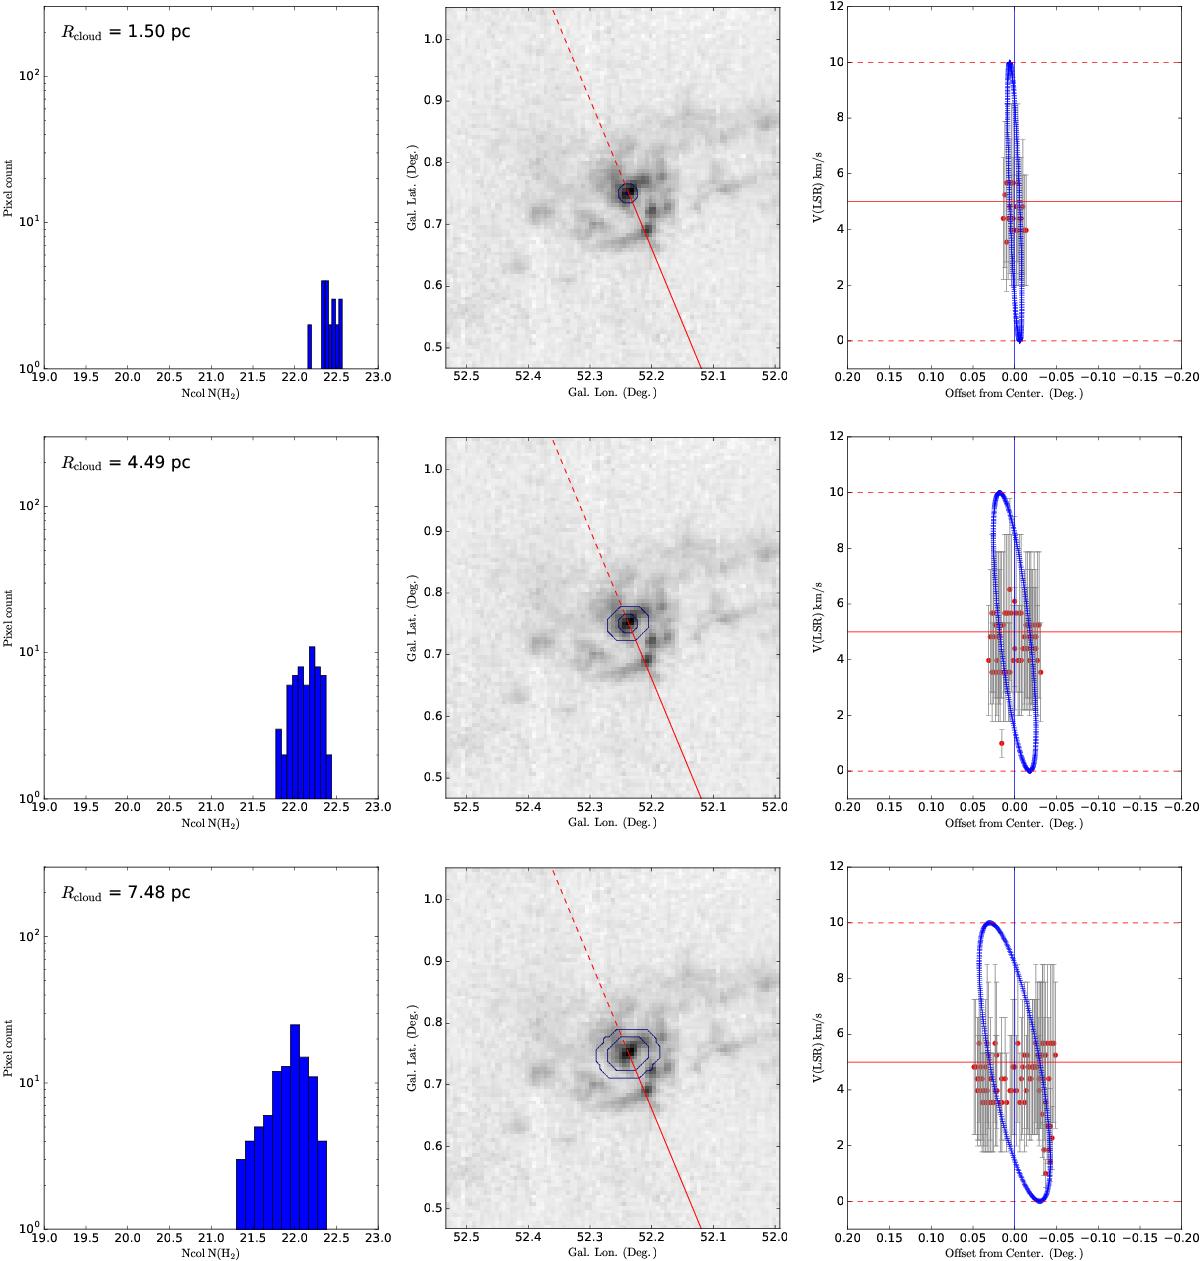
Structure of the cloud viewed within rings. On the left panels, we present the distributions of estimated H2 column densities of the pixels. The mean radii of the rings (rcloud) are indicated at the upper left corners of each panel. In the middle panels, we plot the boundaries of the rings. The proposed rotational axis is represented by the red lines. The red solid lines represent parts of the rotational axes that are in front of the cloud, and the red dashed lines represent parts of the rotational axes that are at the back of the cloud. The right panels present the velocity centroids of the emission in the position-velocity space. Here, we have projected individual line of sight observations onto the major axis of ellipsoid representing the cloud, and the x-axes are the projected offests from the centres. The horizontal lines in the right panels denote the range of velocities within which the gas is gravitationally bound to the cloud. For each line of sight, we plot the velocity centroids and the FWHMs. The centroids of the emission lines are represented as the red symbols, and the FWHMs of the of the emission lines are represented as the errorbars. The horizontal red lines represent the systemic velocity of the cloud, which is 5km s-1. The blue curve is the expected rotational signature assuming the balance between rotation and gravity (Sect. 3.2). The vertical blue lines in the middle and right panels indicate the centre of the cloud. This figure is to be continued in the next page.
Current usage metrics show cumulative count of Article Views (full-text article views including HTML views, PDF and ePub downloads, according to the available data) and Abstracts Views on Vision4Press platform.
Data correspond to usage on the plateform after 2015. The current usage metrics is available 48-96 hours after online publication and is updated daily on week days.
Initial download of the metrics may take a while.