Fig. C.1
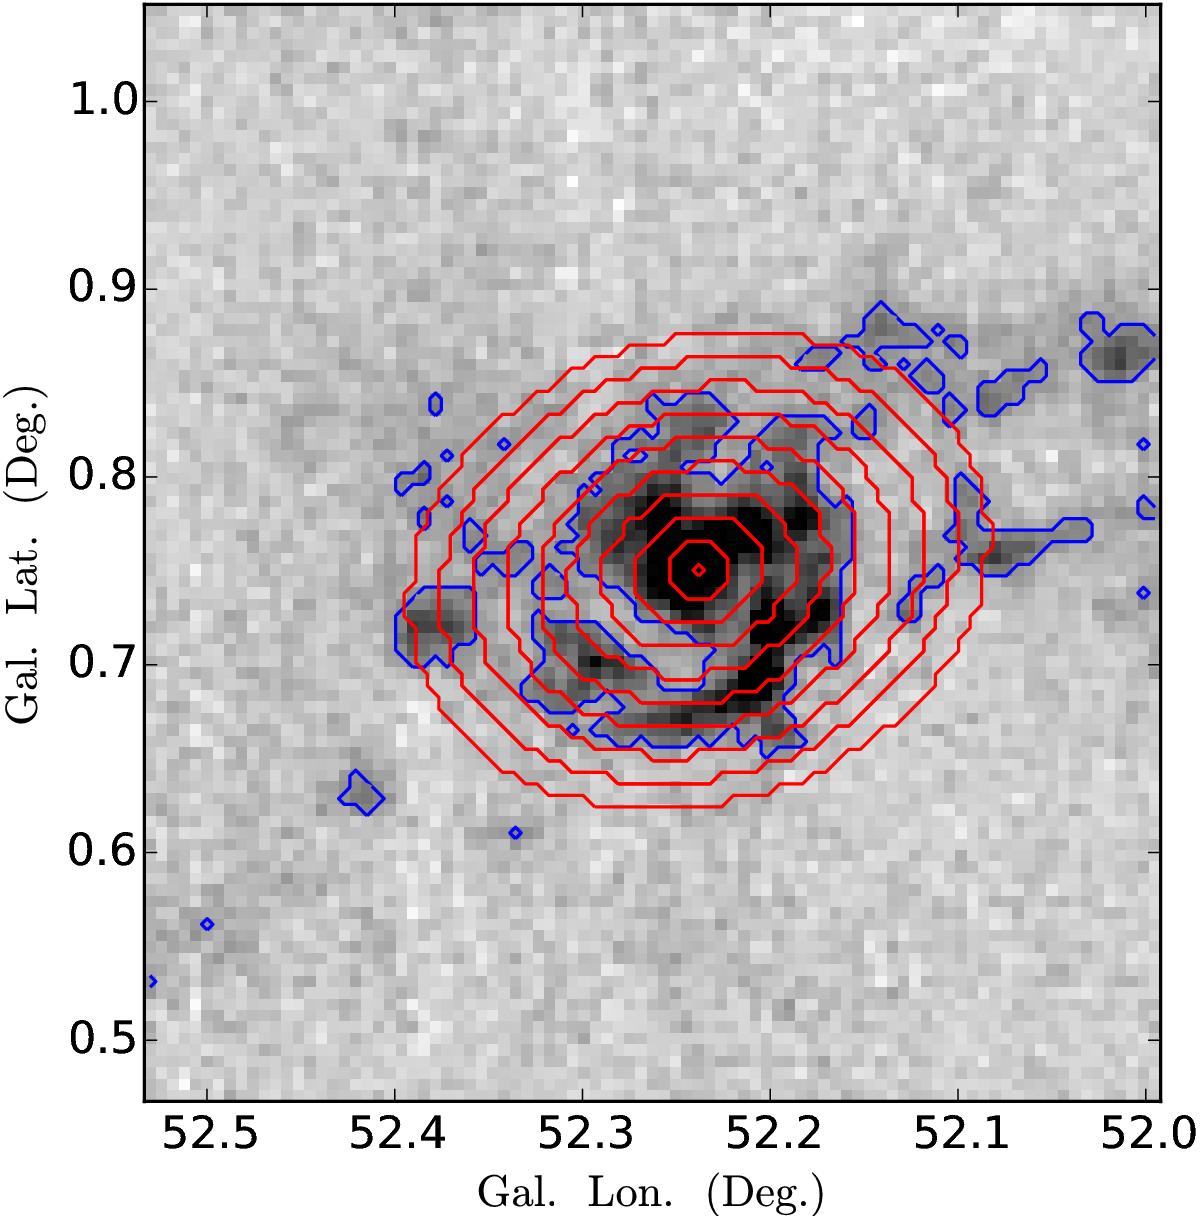
A demonstration of our ring-based analysis of the cloud. The spacing of the rings are 2.7 pc, which is comparable to the beam size (which is 2.2 pc). The blue solid lines stand for the region within which the emission is analysed. The cut was made at ![]() , This corresponds to 3.5 times the rms noise level. The red contours denote the boundaries of the rings that we use to divide and analyse the kinematic structure of the Spiral Cloud.
, This corresponds to 3.5 times the rms noise level. The red contours denote the boundaries of the rings that we use to divide and analyse the kinematic structure of the Spiral Cloud.
Current usage metrics show cumulative count of Article Views (full-text article views including HTML views, PDF and ePub downloads, according to the available data) and Abstracts Views on Vision4Press platform.
Data correspond to usage on the plateform after 2015. The current usage metrics is available 48-96 hours after online publication and is updated daily on week days.
Initial download of the metrics may take a while.