Fig. 1
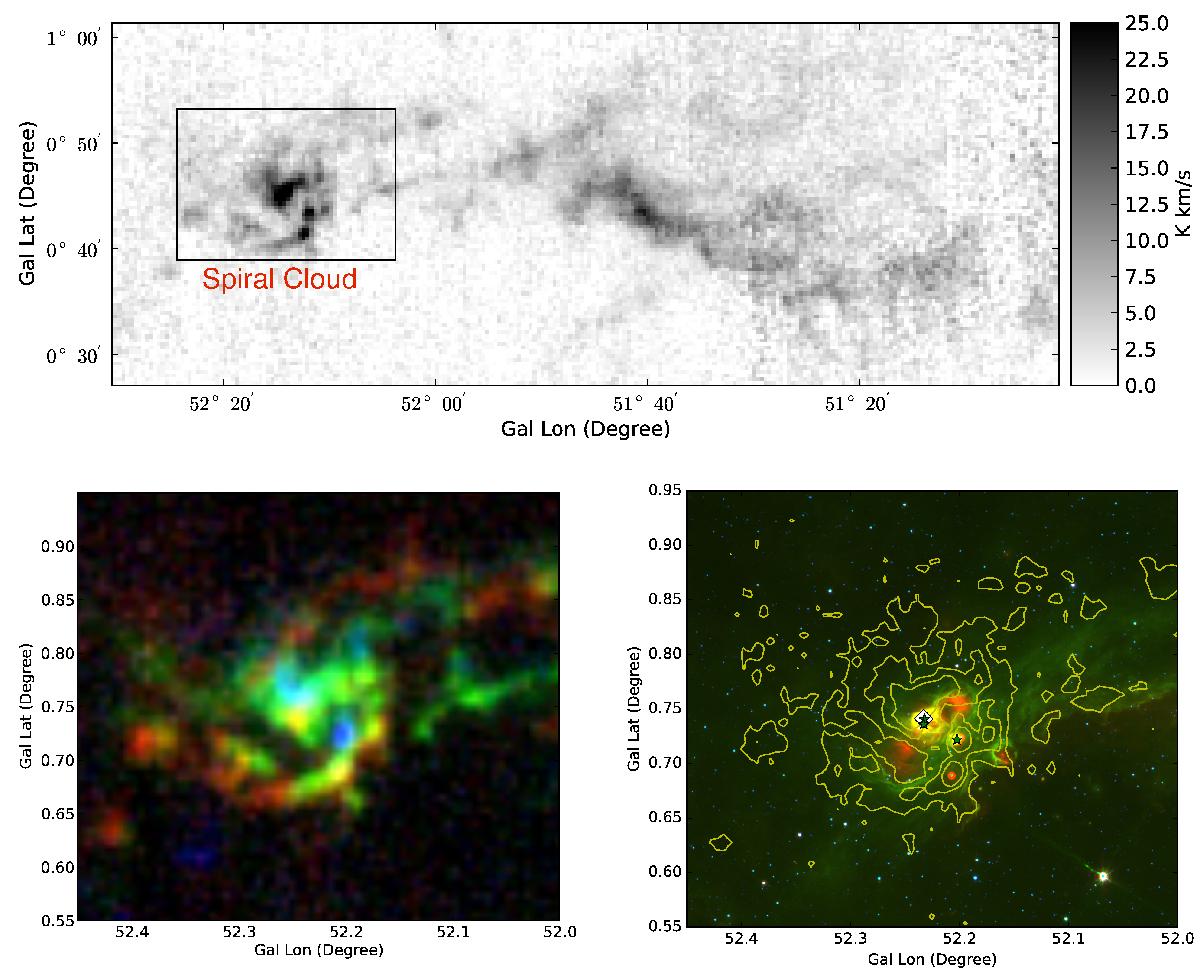
Upper panel: 13CO(1–0) emission integrated from −4.5 to 15.0 kms-1 from the GRS (Jackson et al. 2006). The cloud G052.24+00.74 is on the left side. This cloud is connected with the neighbouring cloud G051.69+00.74 by some filamentary gas wisps. Channel maps of the region can be found in Appendix A. Lower left panel: composite three-color image of the 13CO(1–0) emission from the Spiral Cloud G052.24+00.74. Red: 6.52 <vlsr< 15.0kms-1; green: 3.12 <vlsr< 6.10kms-1; blue: −4.53 <vlsr< 2.7kms-1. The velocity centroid map and velocity FWHM map can be found in Appendix D. Lower right panel: Spitzer GLIMPSE (Benjamin et al. 2003) and MPISGAL three-color image of the Spiral Cloud G052.24+00.74. Red: 24 μm; green: 8 μm; blue: 3.6 μm. Overlaid contours are the velocity-integrated 13CO(1–0) emission (integrated from −4.5 km s-1<vlsr< 11.5km s-1). Contours correspond to 5.1, 10.2, 15.3 Kkms-1. The white diamond at the centre stands for a star cluster discovered in the GLIMPSE survey (Mercer et al. 2005), and the green stars stand for H ii regions collected from the literature (Lockman 1989; Urquhart et al. 2009).
Current usage metrics show cumulative count of Article Views (full-text article views including HTML views, PDF and ePub downloads, according to the available data) and Abstracts Views on Vision4Press platform.
Data correspond to usage on the plateform after 2015. The current usage metrics is available 48-96 hours after online publication and is updated daily on week days.
Initial download of the metrics may take a while.