Fig. 9
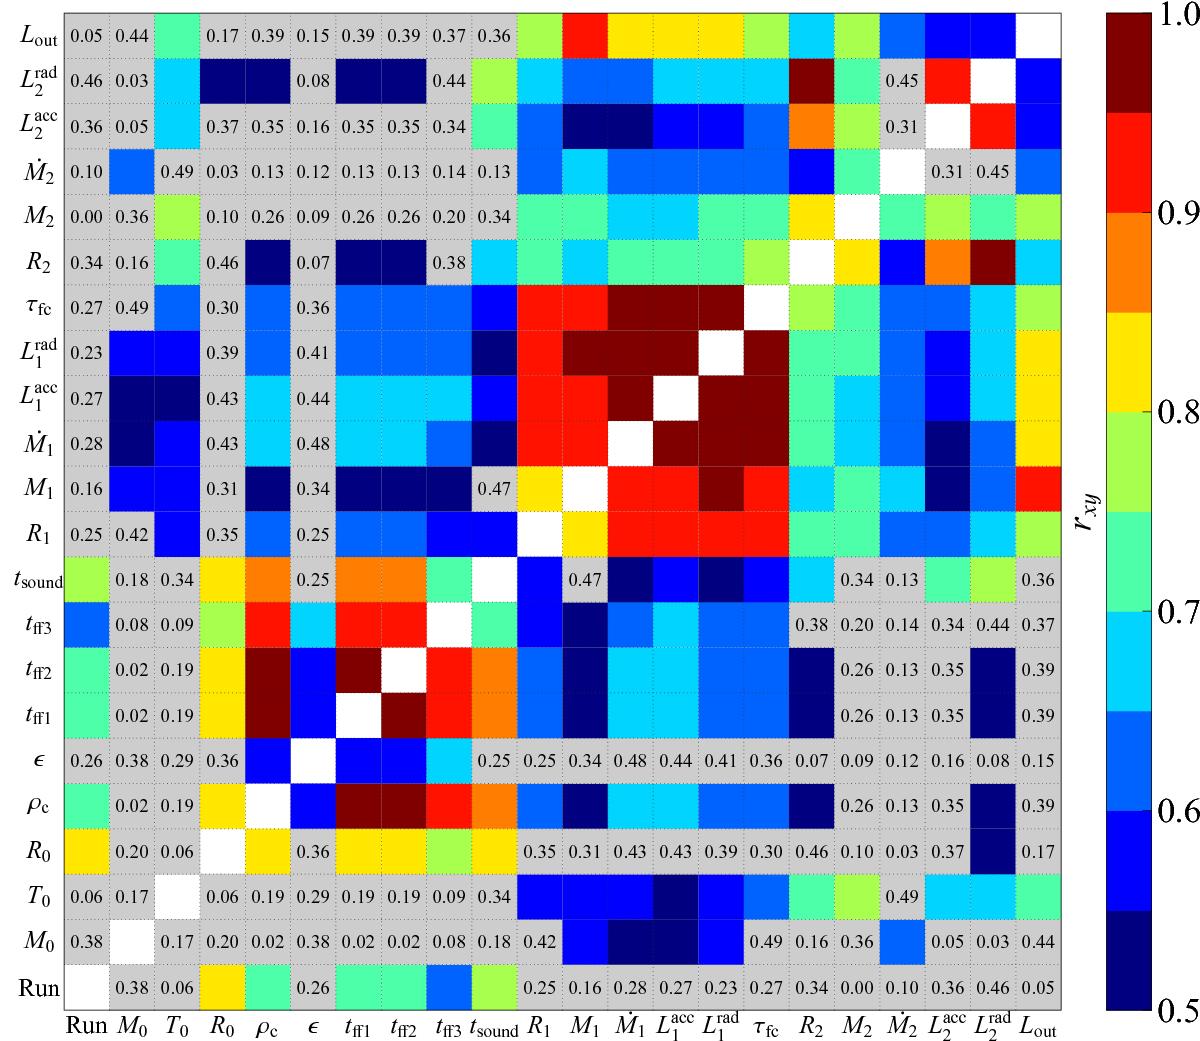
Correlation matrix for the parameters and core properties in Table C.1. The correlations of the type rxx in the white diagonal have been ignored. For rxy< 0.5, the values are given in the cells for indicative purposes, and have intentionally been made less visible to avoid cluttering the figure with too many insignificant values. The interested reader should be able to see the numbers by zooming in enough on the figure. Each square links to a correlation plot stored in the online database. (Interactive image with hyperlinks available in the PDF version.)
Current usage metrics show cumulative count of Article Views (full-text article views including HTML views, PDF and ePub downloads, according to the available data) and Abstracts Views on Vision4Press platform.
Data correspond to usage on the plateform after 2015. The current usage metrics is available 48-96 hours after online publication and is updated daily on week days.
Initial download of the metrics may take a while.