Fig. 8
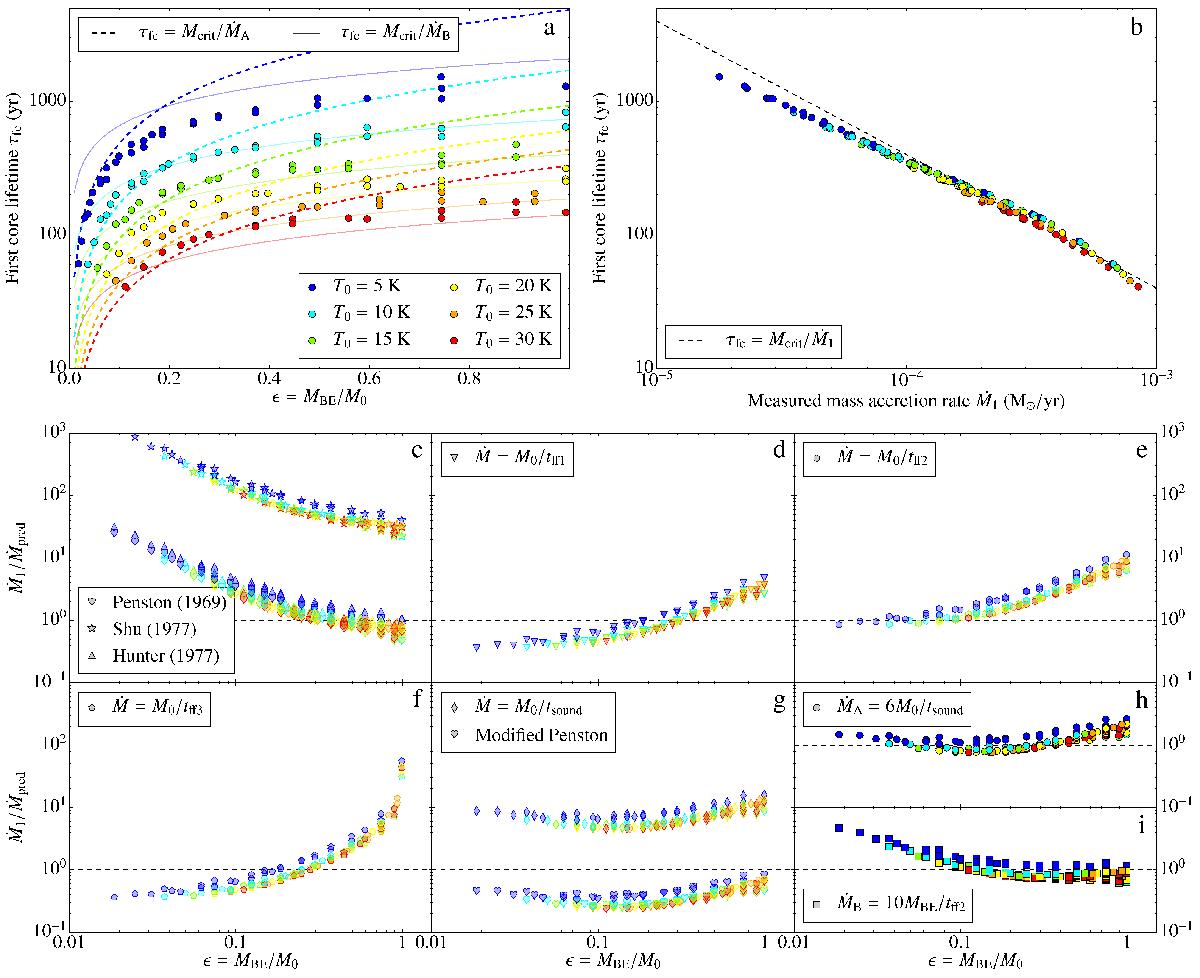
a) First core lifetime τfc as a function of ϵ measured in the simulations (circles). The dashed and thin solid lines represent our analytical predictions (see text). b) First core lifetime as a function of mass accretion rate for all runs. The black dashed line portrays a simple estimate from dimensional arguments (see text). c)–i) Ratio of the mass accretion rate measured in the simulation ![]() to various predictions Ṁpred from numerical and similarity solutions, as a function of ϵ. c) The hearts represent the similarity solution of Larson (1969) and Penston (1969), the stars are the solution of Shu (1977), while the triangles are from the results of Hunter (1977). In panels d) to f), the Ṁpred estimate is obtained from dividing the initial cloud mass M0 by the free-fall times tff1, tff2, and tff3. g) The hearts represent a modified version of Penston’s formula, which is equivalent, barring a scaling factor, to the prediction using the cloud sound crossing time (diamonds). h) The circles represent the first best fitting formula ṀA we have used to predict the lifetimes. i) The squares show the second mass accretion rate estimate ṀB we have selected for our analysis. The colours in all panels code for different initial temperatures (see legend in panel a)).
to various predictions Ṁpred from numerical and similarity solutions, as a function of ϵ. c) The hearts represent the similarity solution of Larson (1969) and Penston (1969), the stars are the solution of Shu (1977), while the triangles are from the results of Hunter (1977). In panels d) to f), the Ṁpred estimate is obtained from dividing the initial cloud mass M0 by the free-fall times tff1, tff2, and tff3. g) The hearts represent a modified version of Penston’s formula, which is equivalent, barring a scaling factor, to the prediction using the cloud sound crossing time (diamonds). h) The circles represent the first best fitting formula ṀA we have used to predict the lifetimes. i) The squares show the second mass accretion rate estimate ṀB we have selected for our analysis. The colours in all panels code for different initial temperatures (see legend in panel a)).
Current usage metrics show cumulative count of Article Views (full-text article views including HTML views, PDF and ePub downloads, according to the available data) and Abstracts Views on Vision4Press platform.
Data correspond to usage on the plateform after 2015. The current usage metrics is available 48-96 hours after online publication and is updated daily on week days.
Initial download of the metrics may take a while.