Fig. 6
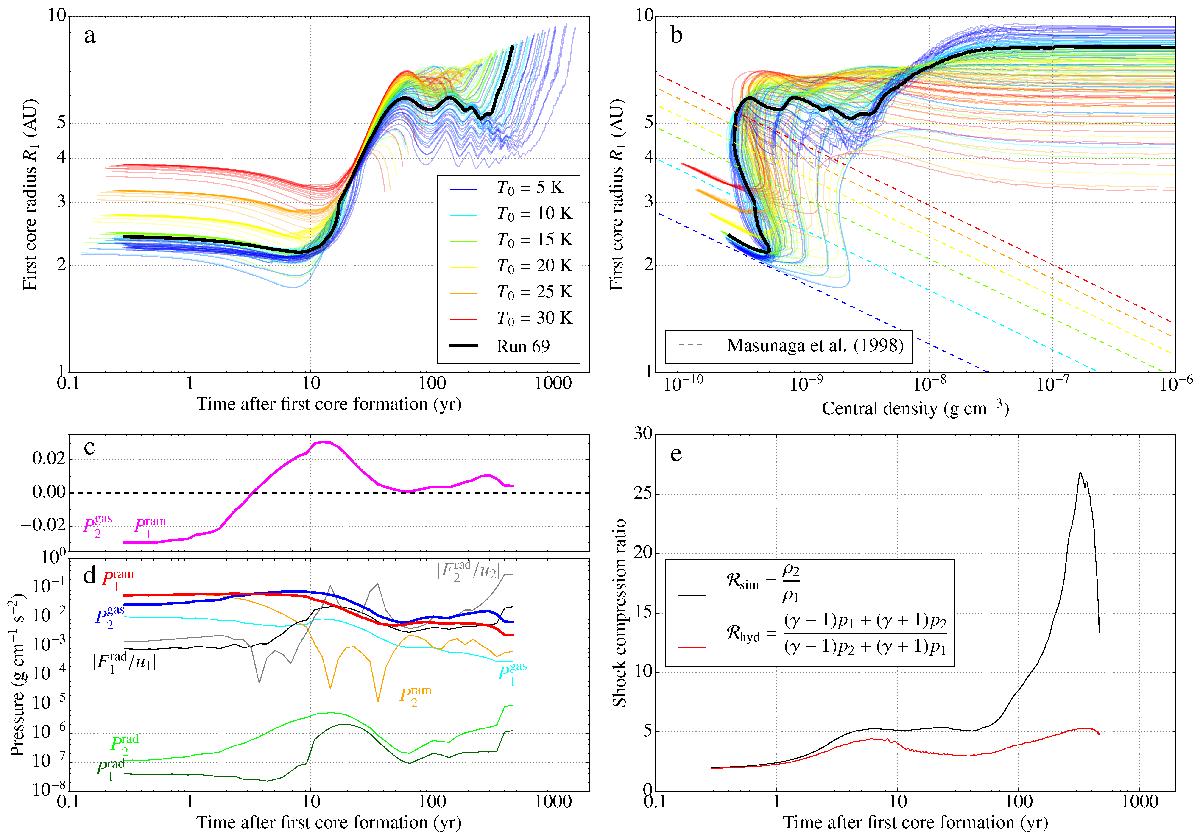
a) First core radius as a function of time, where t = 0 corresponds to the time when the first core accretion shock is formed. The different colours represent different initial cloud temperatures T0 (see legend). The thick black line is for run 69. b) First core radius as a function of central density (solid lines), alongside the (re-scaled) analytical predictions of Masunaga et al. (1998, dashed lines). The colour coding is the same as in panel a). c) Difference between the downstream gas pressure and the upstream ram pressure. d) Downstream gas pressure (blue), upstream ram pressure (red) and radiation pressures (greens) just upstream (subscript 1) and downstream (subscript 2) of the first core accretion shock, in run 69. The upstream radiative fluxes, scaled with the local gas velocity for dimensional coherence, are also plotted for relative comparison in the total energy budget (black). e) First core accretion shock compression ratio for run 69 measured in the simulation (black) and predicted for a non-radiative shock (red).
Current usage metrics show cumulative count of Article Views (full-text article views including HTML views, PDF and ePub downloads, according to the available data) and Abstracts Views on Vision4Press platform.
Data correspond to usage on the plateform after 2015. The current usage metrics is available 48-96 hours after online publication and is updated daily on week days.
Initial download of the metrics may take a while.