Fig. 5
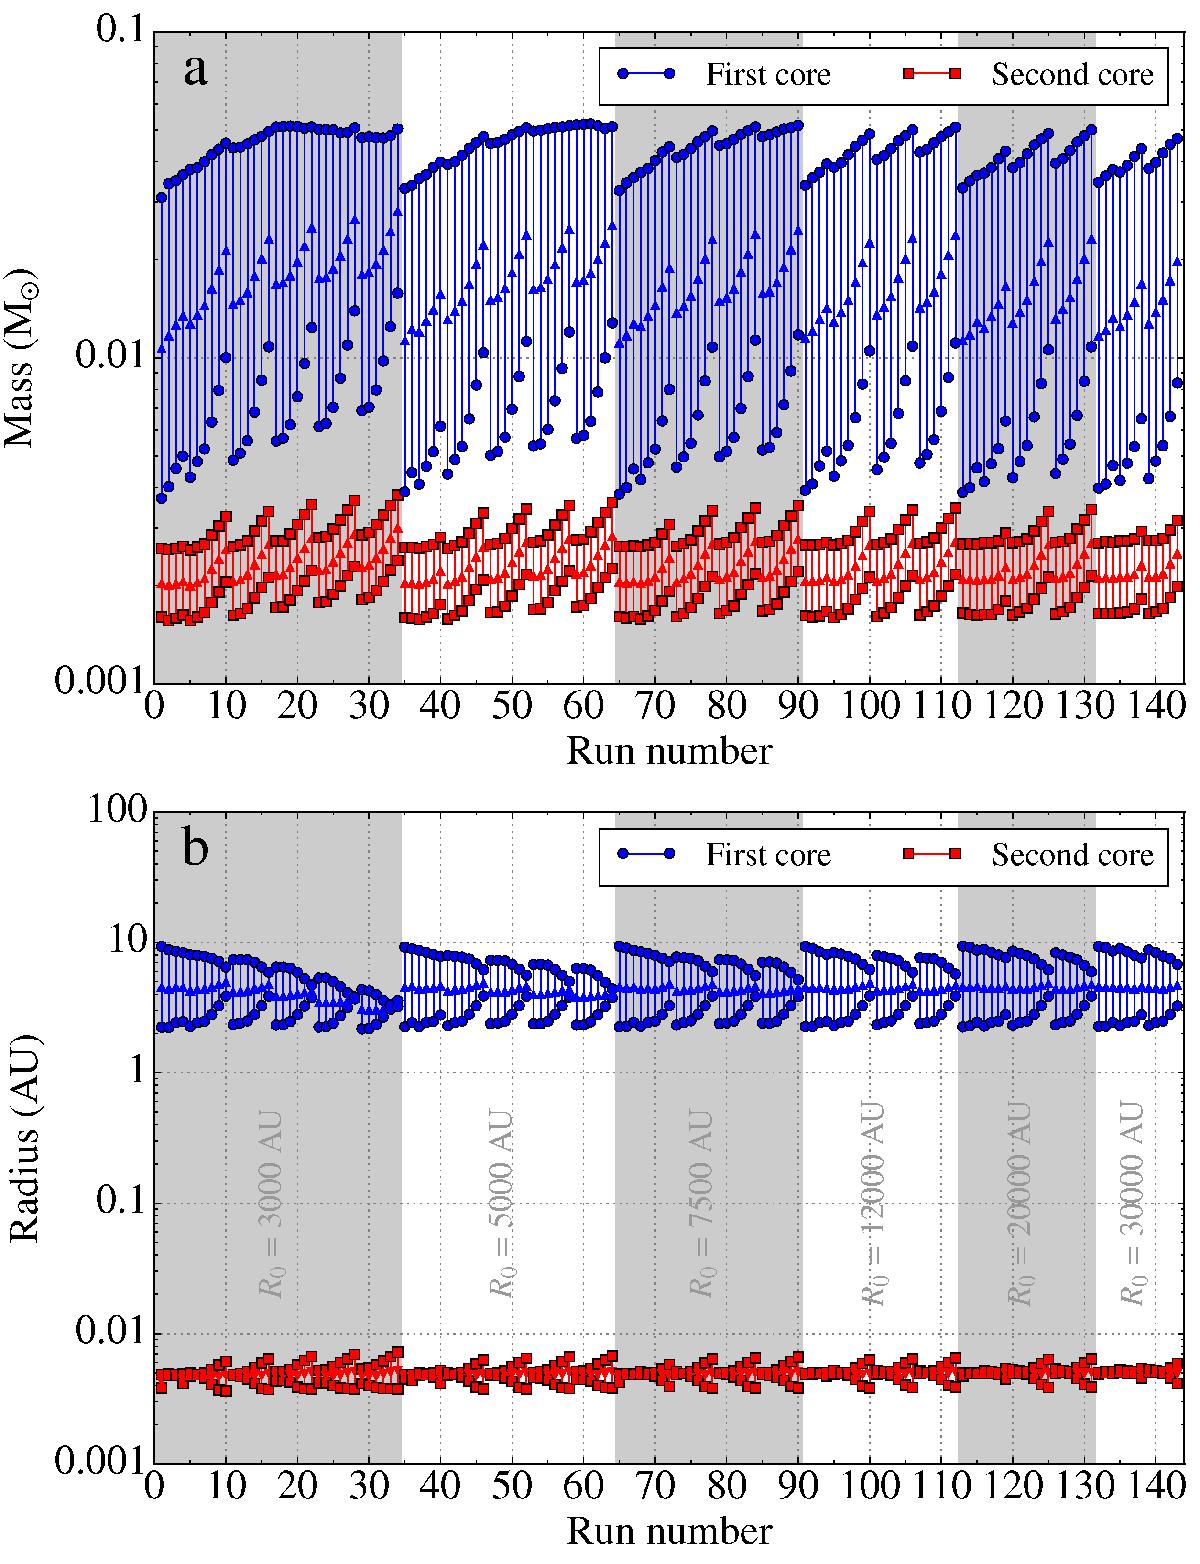
First and second core mass (a) and radius (b) for all 143 runs. Each mass and radius has a starting and an end point. The starting point represents the quantity when the core has just formed, while the end point is at the end of the simulation. A small arrow in the middle of each segment points in the direction from start to end. The vertical alternating grey and white bands indicate changes in initial radius (see panel b) for values of R0).
Current usage metrics show cumulative count of Article Views (full-text article views including HTML views, PDF and ePub downloads, according to the available data) and Abstracts Views on Vision4Press platform.
Data correspond to usage on the plateform after 2015. The current usage metrics is available 48-96 hours after online publication and is updated daily on week days.
Initial download of the metrics may take a while.