Free Access
Fig. 4
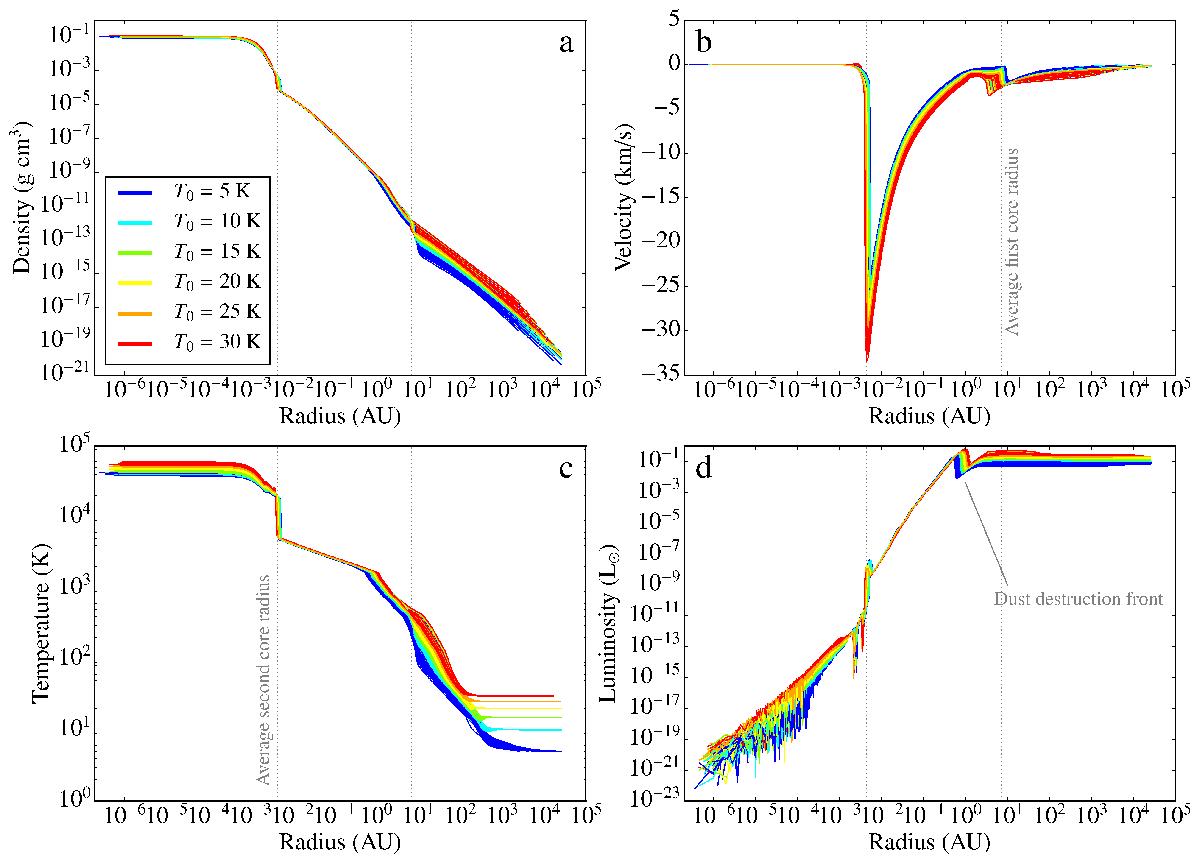
Radial profiles of the gas density (a), velocity (b), temperature (c), and luminosity (d) for all 143 runs. The different colours represent different initial temperatures T0 (see legend). The vertical dotted lines mark the positions of the average first and second core radii.
Current usage metrics show cumulative count of Article Views (full-text article views including HTML views, PDF and ePub downloads, according to the available data) and Abstracts Views on Vision4Press platform.
Data correspond to usage on the plateform after 2015. The current usage metrics is available 48-96 hours after online publication and is updated daily on week days.
Initial download of the metrics may take a while.