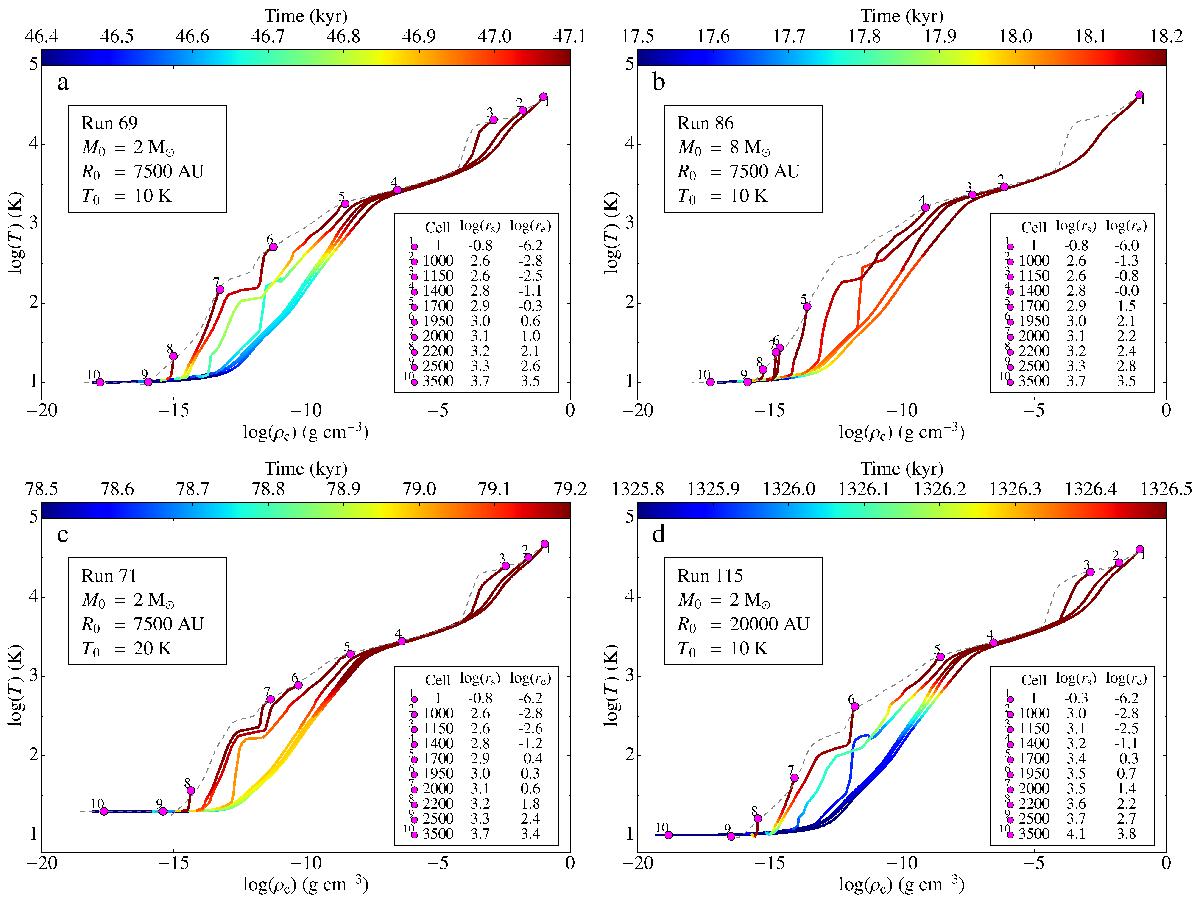
Fig. 3

Evolution track in the density-temperature plane for 10 different pieces of fluid in runs a) 69, b) 86, c) 71, and d) 115. In all panels, 10 cells were selected and followed throughout the simulation. The number of the cell in the mesh is given for each track in the bottom-right inset, along with the cell’s radius at the start of the simulation (“s”) and at the end (“e”). While the cell numbers are the same in all panels, the cell radii change. The colour codes for the time in kyr; the colourbar is different in all panels, but they all display the final 700 yr of evolution. The pink dots show the position of each piece of fluid at the end of the simulation. The dashed grey line traces the final (ρ,T) profile in the entire grid, which connects the pink dots. The inset in the top left corners gives a reminder of the parameters of each run.
Current usage metrics show cumulative count of Article Views (full-text article views including HTML views, PDF and ePub downloads, according to the available data) and Abstracts Views on Vision4Press platform.
Data correspond to usage on the plateform after 2015. The current usage metrics is available 48-96 hours after online publication and is updated daily on week days.
Initial download of the metrics may take a while.


