Fig. 2
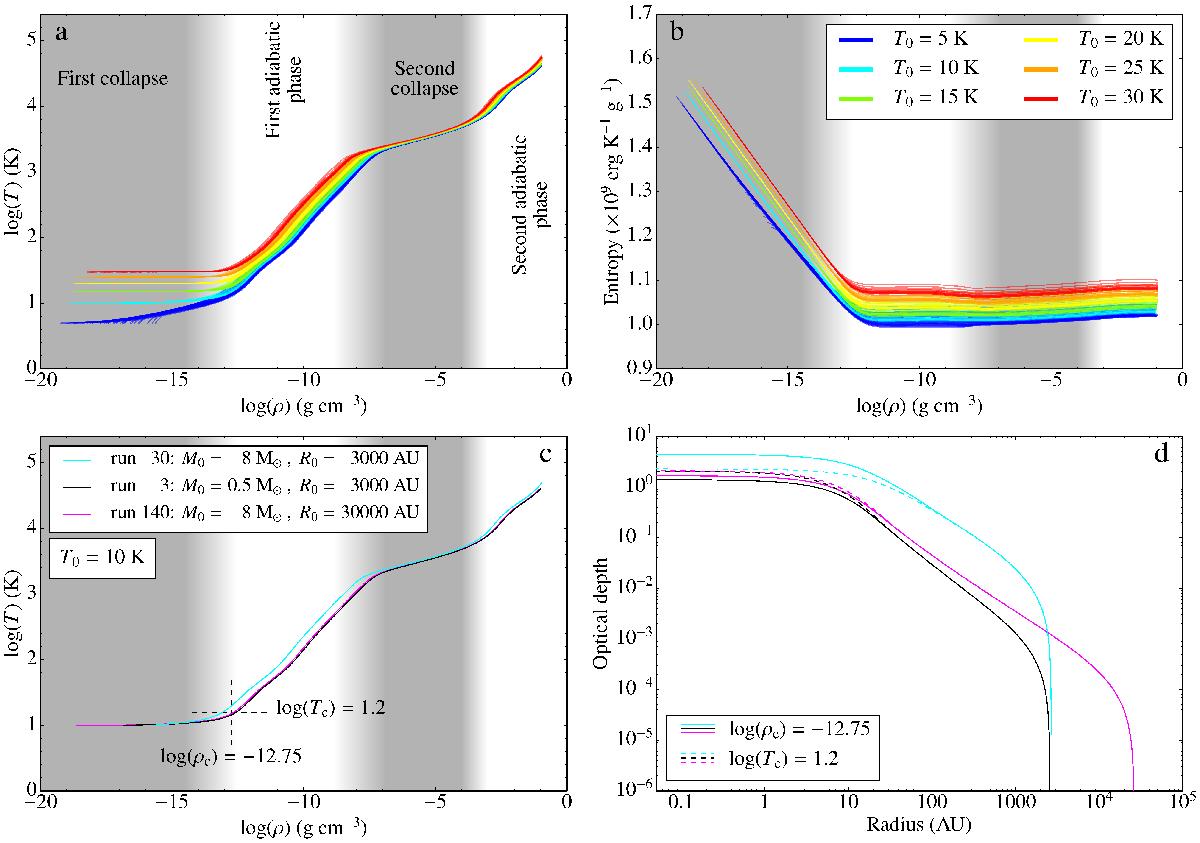
Top row: evolution of the central temperature (a) and entropy (b) as a function of density for all 143 runs. The lines have been colour-coded according to the cloud’s initial temperature T0 (see legend in panel b)). Bottom row: c) evolution of the central temperature as a function of density for runs 30, 3, and 140 (see legend). d) Optical depth of the systems as a function of radius for runs 30, 3, and 140 (same colours as in panel c)), when the central density has just reached log (ρc) = −12.75 g cm-3 (solid), and when the central temperature has reached log (Tc) = 1.2 K (dashed).
Current usage metrics show cumulative count of Article Views (full-text article views including HTML views, PDF and ePub downloads, according to the available data) and Abstracts Views on Vision4Press platform.
Data correspond to usage on the plateform after 2015. The current usage metrics is available 48-96 hours after online publication and is updated daily on week days.
Initial download of the metrics may take a while.