Fig. B.1
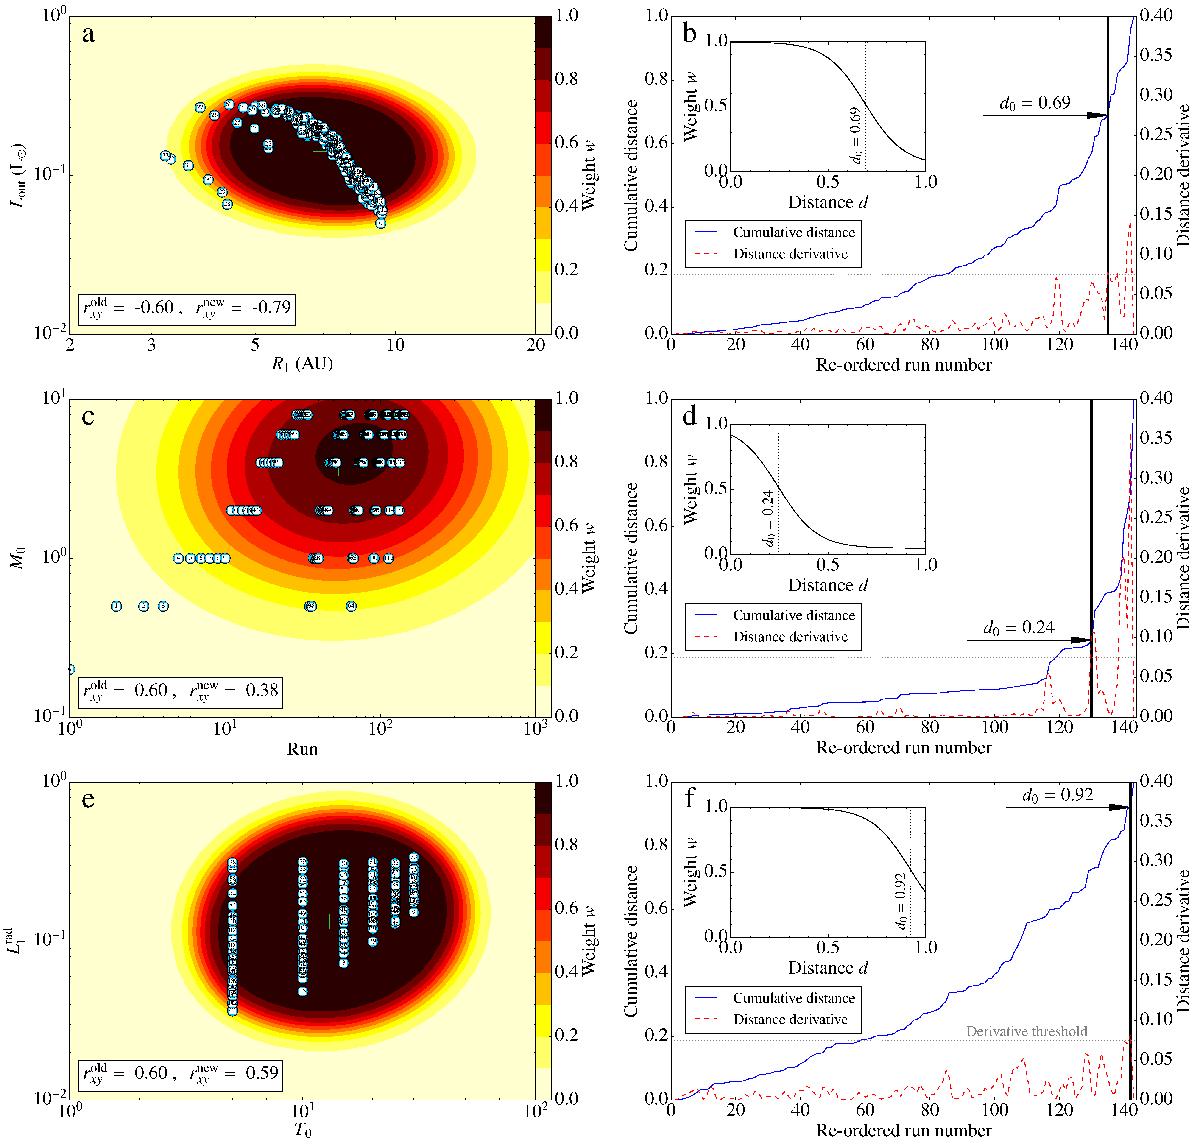
Illustration of the weighting scheme for computing correlations between two variables x and y. The top row shows the relation between Lout and R1, the middle row is for M0 as a function of run number, while the bottom row displays ![]() versus T0. In the left column, the light blue dots represent the different simulations (the run numbers are indicated inside each symbol), while the coloured contours show the normalised weights given to the data points. In the right column, the blue solid line represents the cumulative distances for each run, sorted in ascending order. The red dashed line is the derivative of this distance distribution. The thick vertical black solid line marks the position of the first derivative spike above 0.075 (grey dotted line), while the black arrow reads the value of the distance d0 on the blue curve at the location of the derivative spike. The insets show the weighting functions w(d,d0).
versus T0. In the left column, the light blue dots represent the different simulations (the run numbers are indicated inside each symbol), while the coloured contours show the normalised weights given to the data points. In the right column, the blue solid line represents the cumulative distances for each run, sorted in ascending order. The red dashed line is the derivative of this distance distribution. The thick vertical black solid line marks the position of the first derivative spike above 0.075 (grey dotted line), while the black arrow reads the value of the distance d0 on the blue curve at the location of the derivative spike. The insets show the weighting functions w(d,d0).
Current usage metrics show cumulative count of Article Views (full-text article views including HTML views, PDF and ePub downloads, according to the available data) and Abstracts Views on Vision4Press platform.
Data correspond to usage on the plateform after 2015. The current usage metrics is available 48-96 hours after online publication and is updated daily on week days.
Initial download of the metrics may take a while.