Fig. A.2
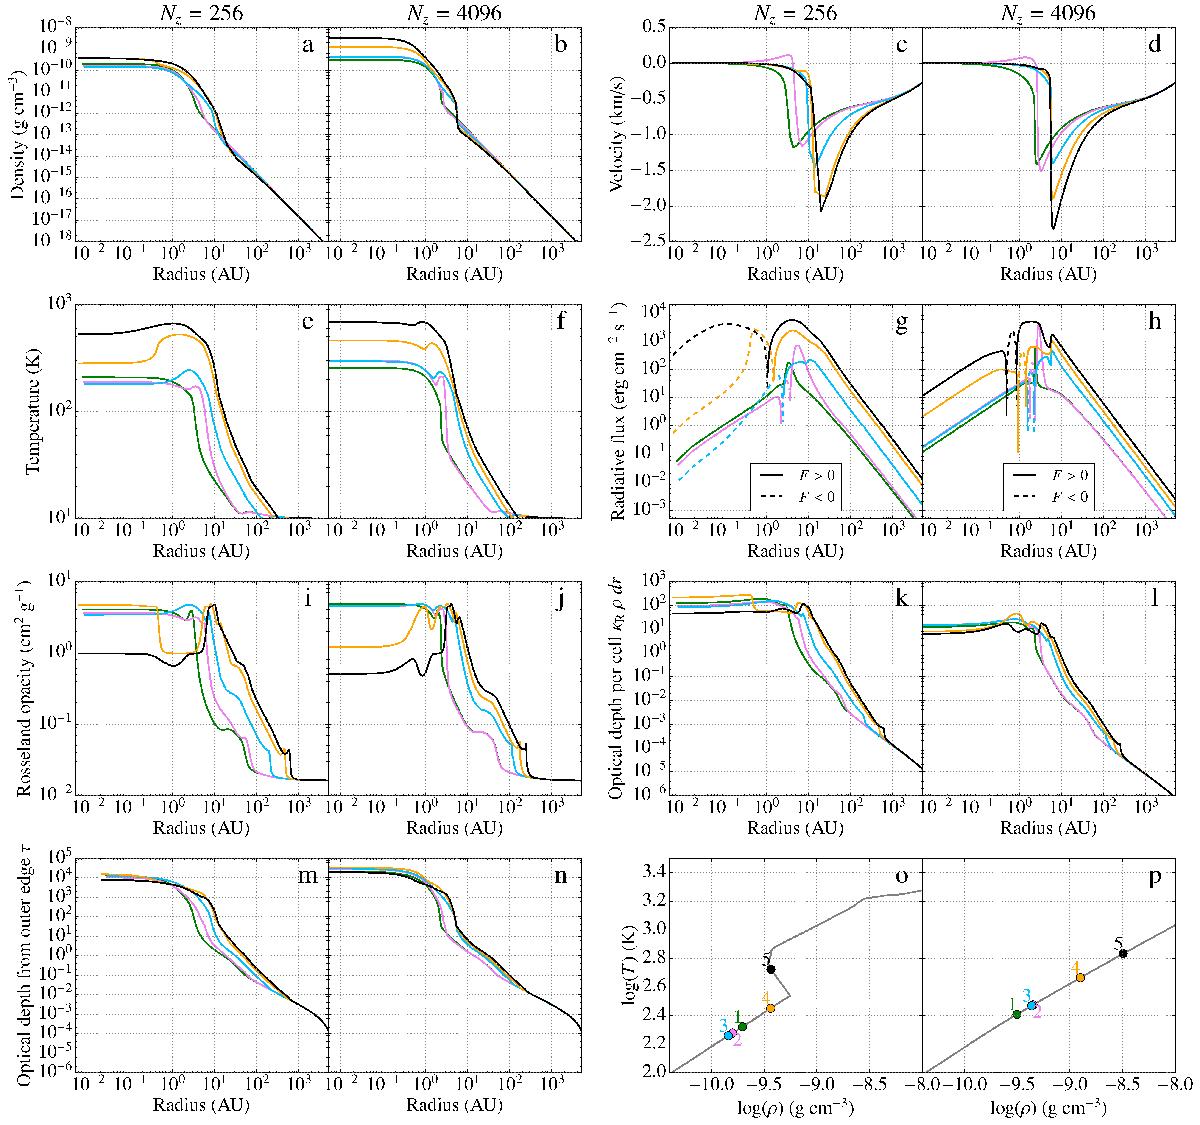
Evolution sequence for two simulations with different resolutions. The first and third columns are for 256 grid cells, while 4096 cells have been used in the second and fourth columns. Panels a) to n) show radial profiles of various quantities, while panels o) and p) show a small portion of the thermal evolutions from Fig. A.1a. The different colours represent a succession of epochs to illusrate the evolution of the system around the “knee” which appears in low-resolution runs. The numbers in panels o) and p) show the order in time of the colours. In panels g) and h), dashed lines represent negative values of the radiative flux (i.e. a flux pointing towards the centre of the system).
Current usage metrics show cumulative count of Article Views (full-text article views including HTML views, PDF and ePub downloads, according to the available data) and Abstracts Views on Vision4Press platform.
Data correspond to usage on the plateform after 2015. The current usage metrics is available 48-96 hours after online publication and is updated daily on week days.
Initial download of the metrics may take a while.