Fig. A.1
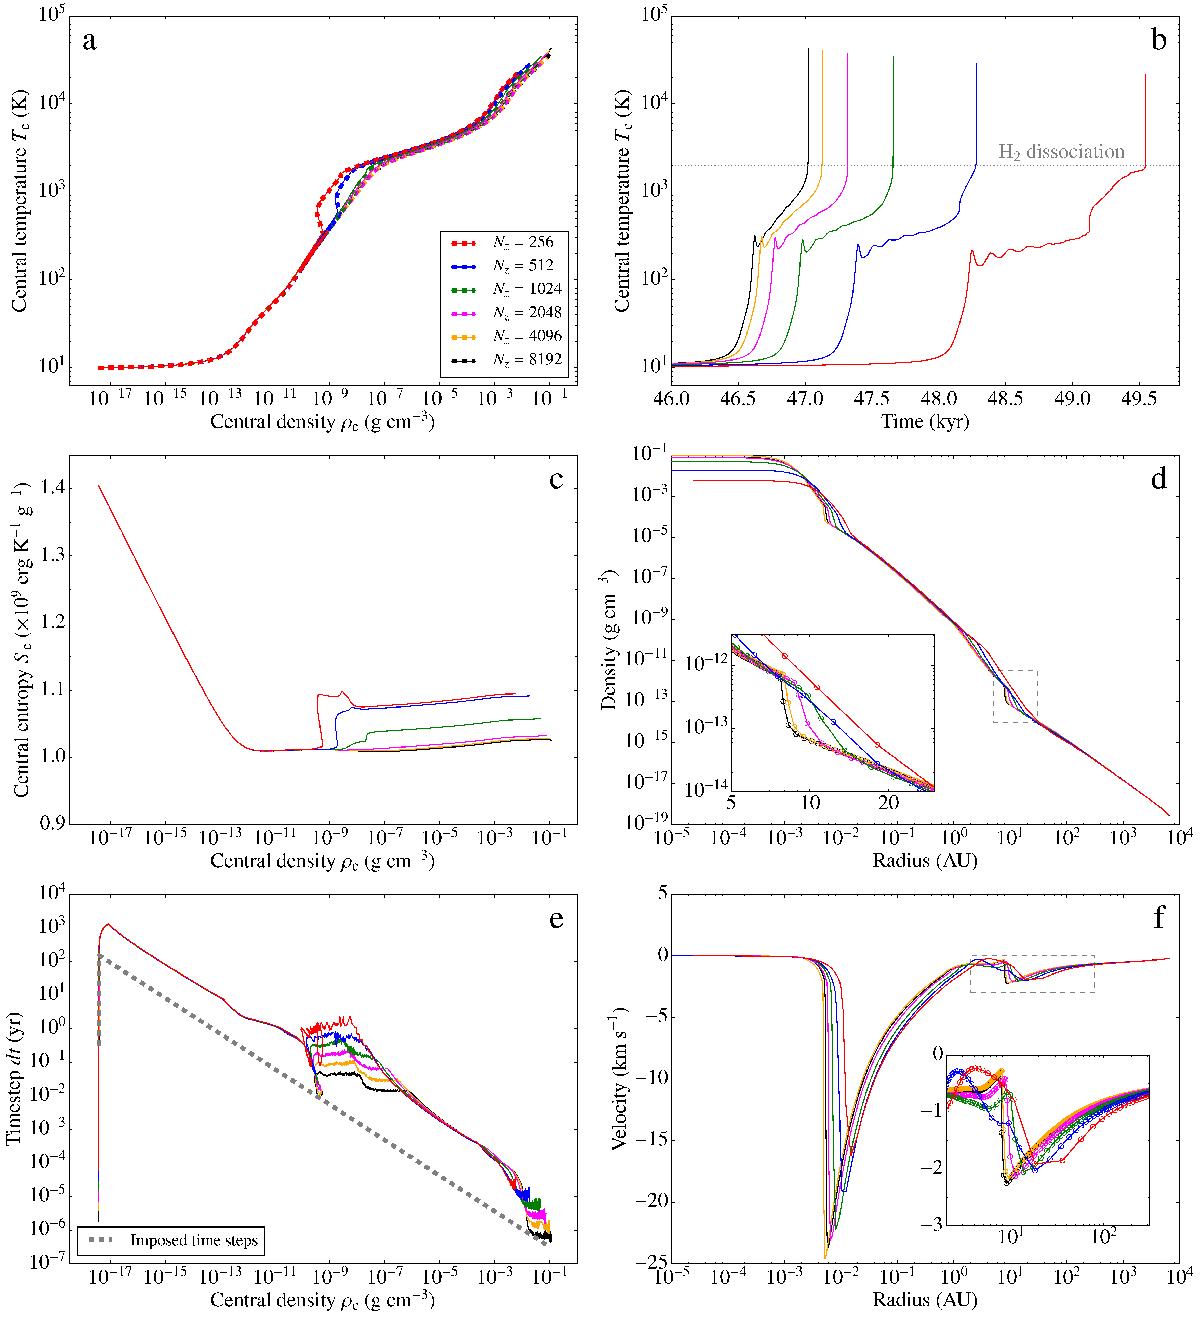
Resolution study for run 69. Panels a) and c) show the temperature and entropy, respectively, of the cell at the centre of the system as a function of density using 256, 512, 1024, 2048, 4096, and 8192 cells (see legend). In panel a), the thin solid lines are for simulations with the standard timestep calculation based on relative variations of primary variables from one time step to the next, while the thick dashed lines are for the re-runs when the values of dt are enforced according to the central gas density (see text). Panel b) shows the central temperature as a function of time. Panels d) and f) show profiles of the gas density and velocity, respectively, as a function of radius, at the end of the simulations. Panel e) shows the integration timesteps in the different simulations as a function of central density. The thick grey dashed line represents the forced values of dt we have chosen for our temporal resolution re-runs (see text).
Current usage metrics show cumulative count of Article Views (full-text article views including HTML views, PDF and ePub downloads, according to the available data) and Abstracts Views on Vision4Press platform.
Data correspond to usage on the plateform after 2015. The current usage metrics is available 48-96 hours after online publication and is updated daily on week days.
Initial download of the metrics may take a while.