Fig. 11
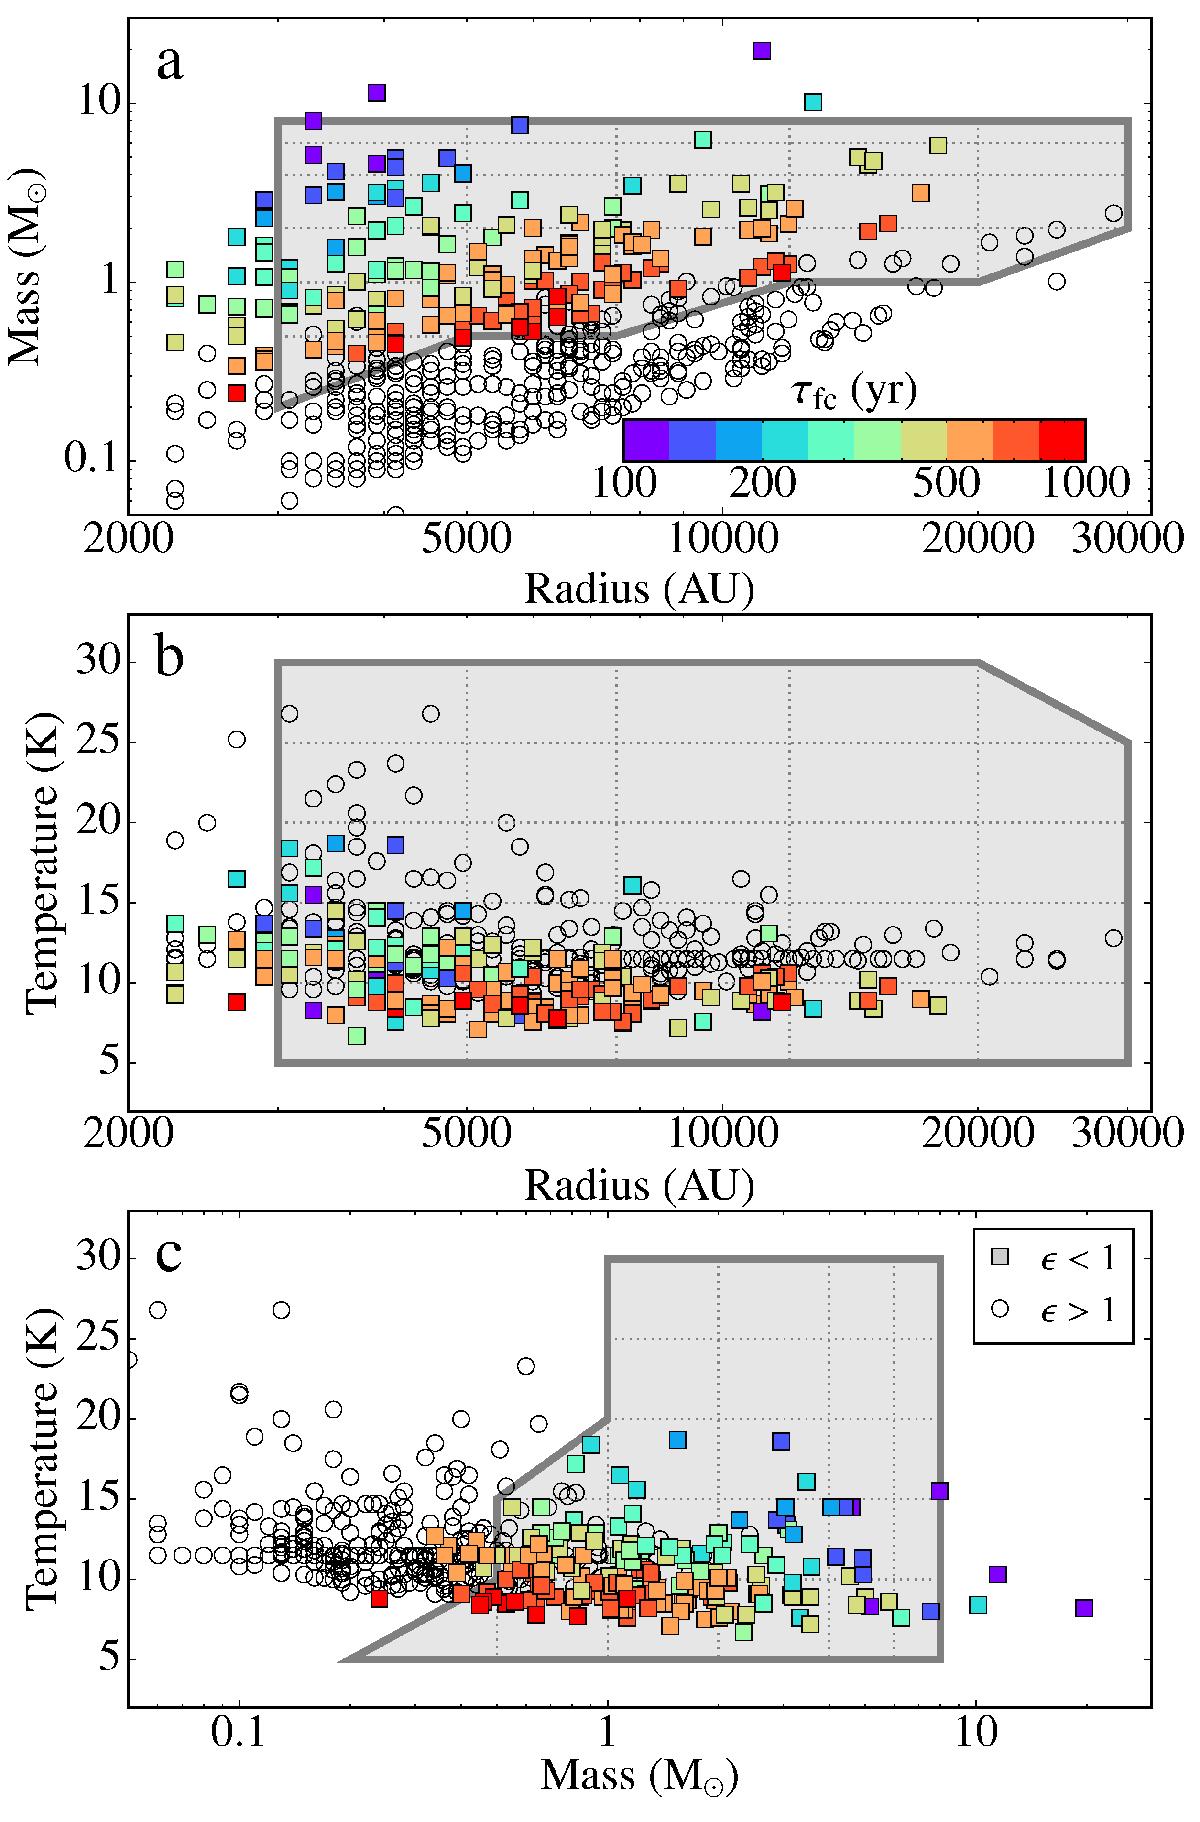
Comparison between the radii, temperatures and masses of the prestellar cores in the Aquila molecular cloud and the parameter space covered by the initial conditions of our set of numerical simulations. In each panel, the empty circles represent observed cores with ϵ > 1, while the coloured squares are for cores with ϵ < 1. The colour of the squares code for their predicted first core lifetimes. The grey area deliniates the simulation parameter space: every corner or intersection of a dotted line with either another dotted line or the thick grey boundary represents one simulation.
Current usage metrics show cumulative count of Article Views (full-text article views including HTML views, PDF and ePub downloads, according to the available data) and Abstracts Views on Vision4Press platform.
Data correspond to usage on the plateform after 2015. The current usage metrics is available 48-96 hours after online publication and is updated daily on week days.
Initial download of the metrics may take a while.