Fig. 1
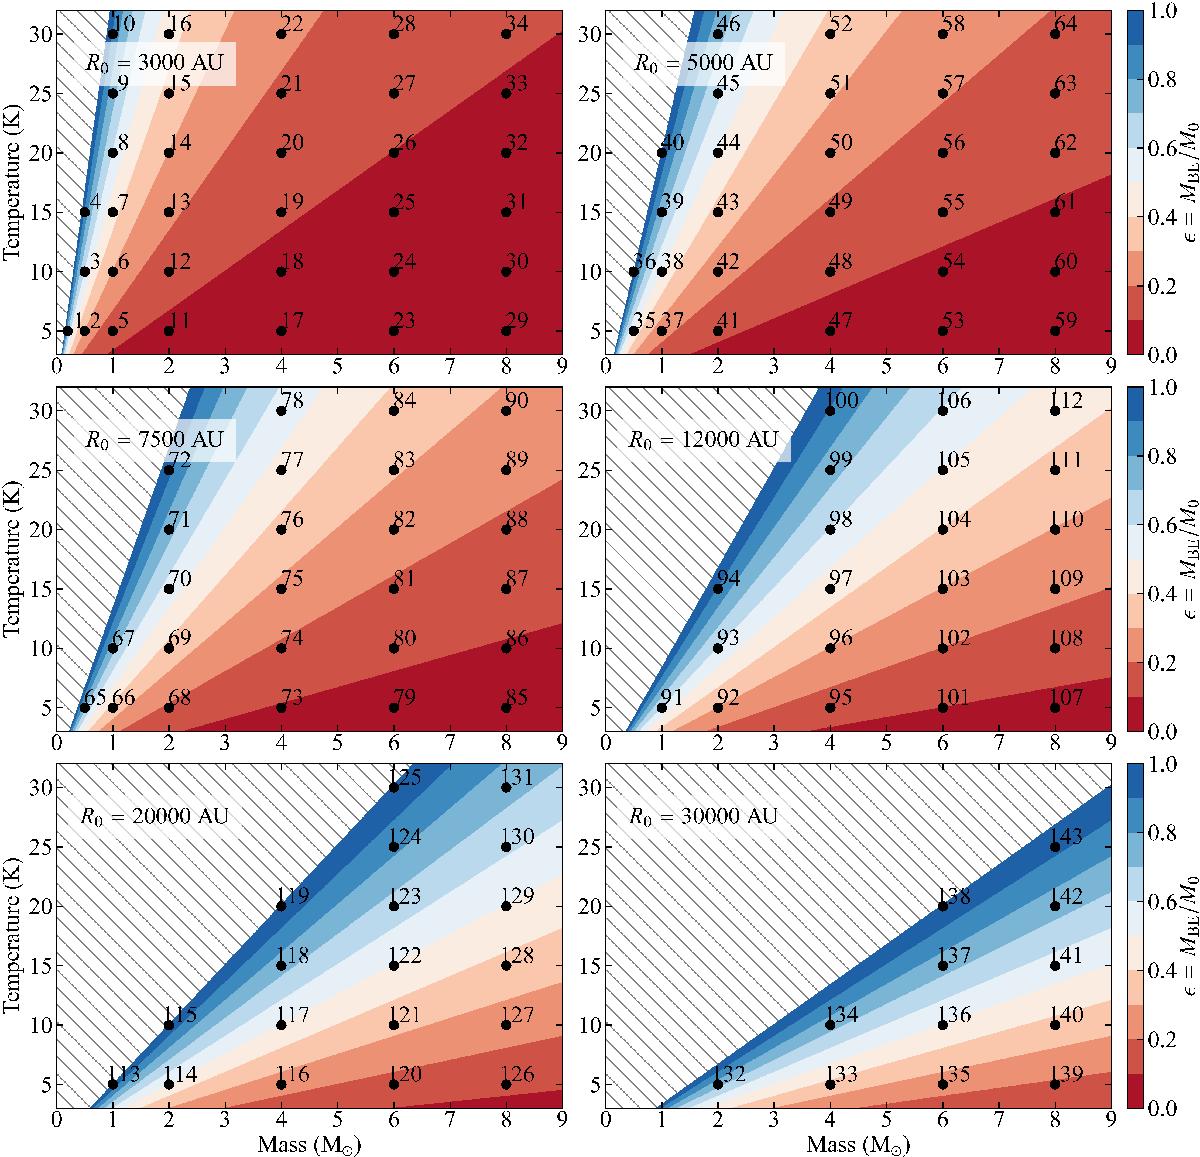
Model parameter space for 6 different radii: R0 = 3000,5000,7500,12 000,20 000,30 000 AU. The hatched area represents clouds that are stable against gravitational collapse, while the colours code for different values of ϵ for clouds in the unstable zone. The ϵ = 1 separating line between hatched and coloured areas is defined in Eq. (5). Each run number links to the corresponding publicly available dataset. (Interactive image with hyperlinks available in the PDF version.)
Current usage metrics show cumulative count of Article Views (full-text article views including HTML views, PDF and ePub downloads, according to the available data) and Abstracts Views on Vision4Press platform.
Data correspond to usage on the plateform after 2015. The current usage metrics is available 48-96 hours after online publication and is updated daily on week days.
Initial download of the metrics may take a while.