Fig. 4
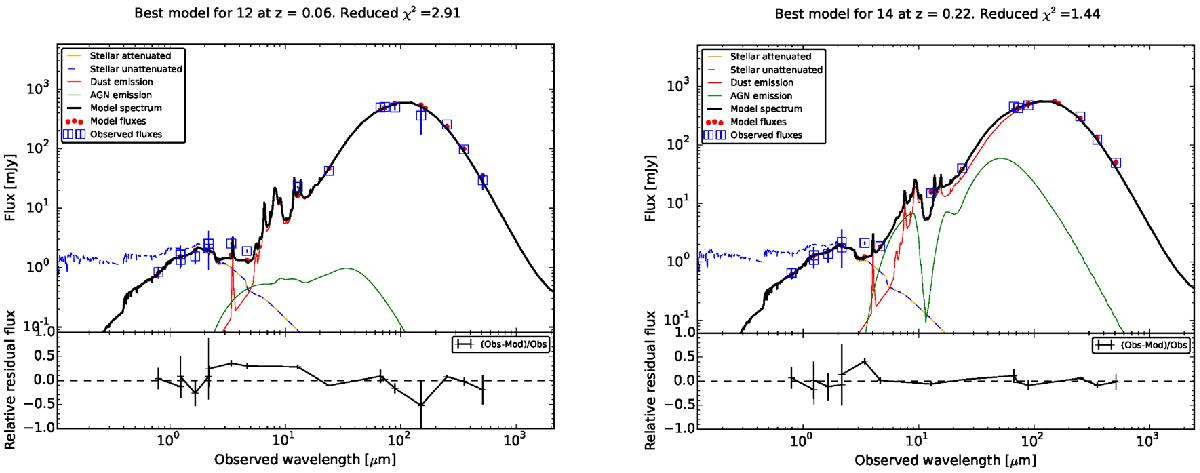
Examples of the best fit models (CIGALE SED fitting code). The left-hand side spectrum is a star-forming galaxy, while the spectrum shown on the right-hand side is ULIRG. Observed fluxes are plotted with open blue squares. Filled red circles correspond to the model fluxes. The final model is plotted as a solid black line. The remaining three lines correspond to the stellar, dust, and AGN components. The relative residual fluxes are plotted at the bottom panel of each spectrum.
Current usage metrics show cumulative count of Article Views (full-text article views including HTML views, PDF and ePub downloads, according to the available data) and Abstracts Views on Vision4Press platform.
Data correspond to usage on the plateform after 2015. The current usage metrics is available 48-96 hours after online publication and is updated daily on week days.
Initial download of the metrics may take a while.