Fig. 3
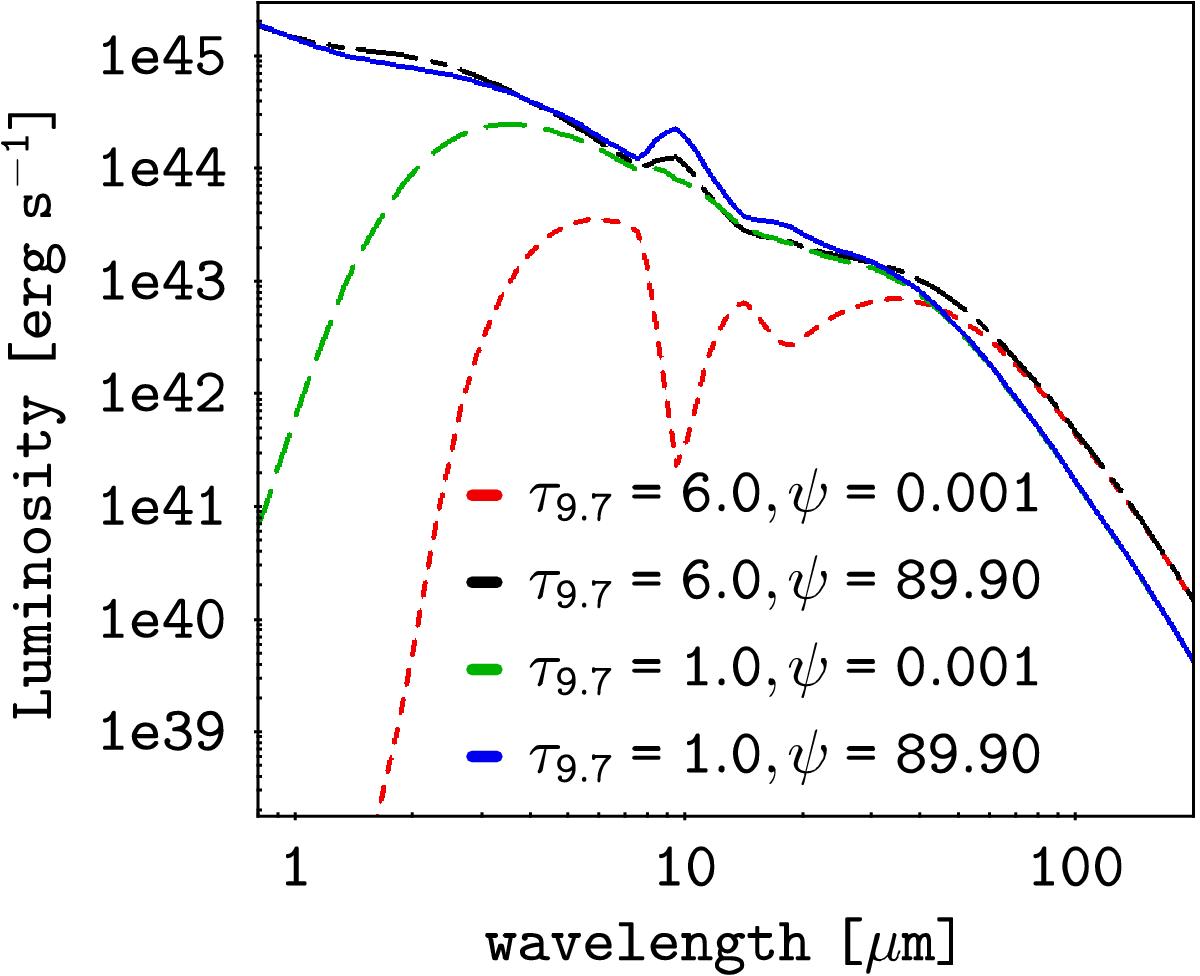
Fritz et al. (2006) AGNs’ SEDs used in our analysis. These templates are built based on two optical depth τ9.7 values (1.0 and 6.0), and the extreme values of the angle between the equatorial axis and the line of sight (ψ). The red dotted line represents τ9.7 = 1.0, and ψ = 89.900 [deg]; the green dashed line corresponds to the τ9.7 = 1.0, and ψ = 0.001 [deg]; the black dashed-dotted line to τ9.7 = 6.0, and ψ = 89.900 [deg]; and the blue solid line to τ9.7 = 6.0, and ψ = 0.001 [deg].
Current usage metrics show cumulative count of Article Views (full-text article views including HTML views, PDF and ePub downloads, according to the available data) and Abstracts Views on Vision4Press platform.
Data correspond to usage on the plateform after 2015. The current usage metrics is available 48-96 hours after online publication and is updated daily on week days.
Initial download of the metrics may take a while.